


Screen Flow
About this lesson
In this learning content, we will examine the process of preparing a flow chart for the “I Have an Idea” project that describes the flow between screens and how users will navigate through the application.
Registration / Login Screens
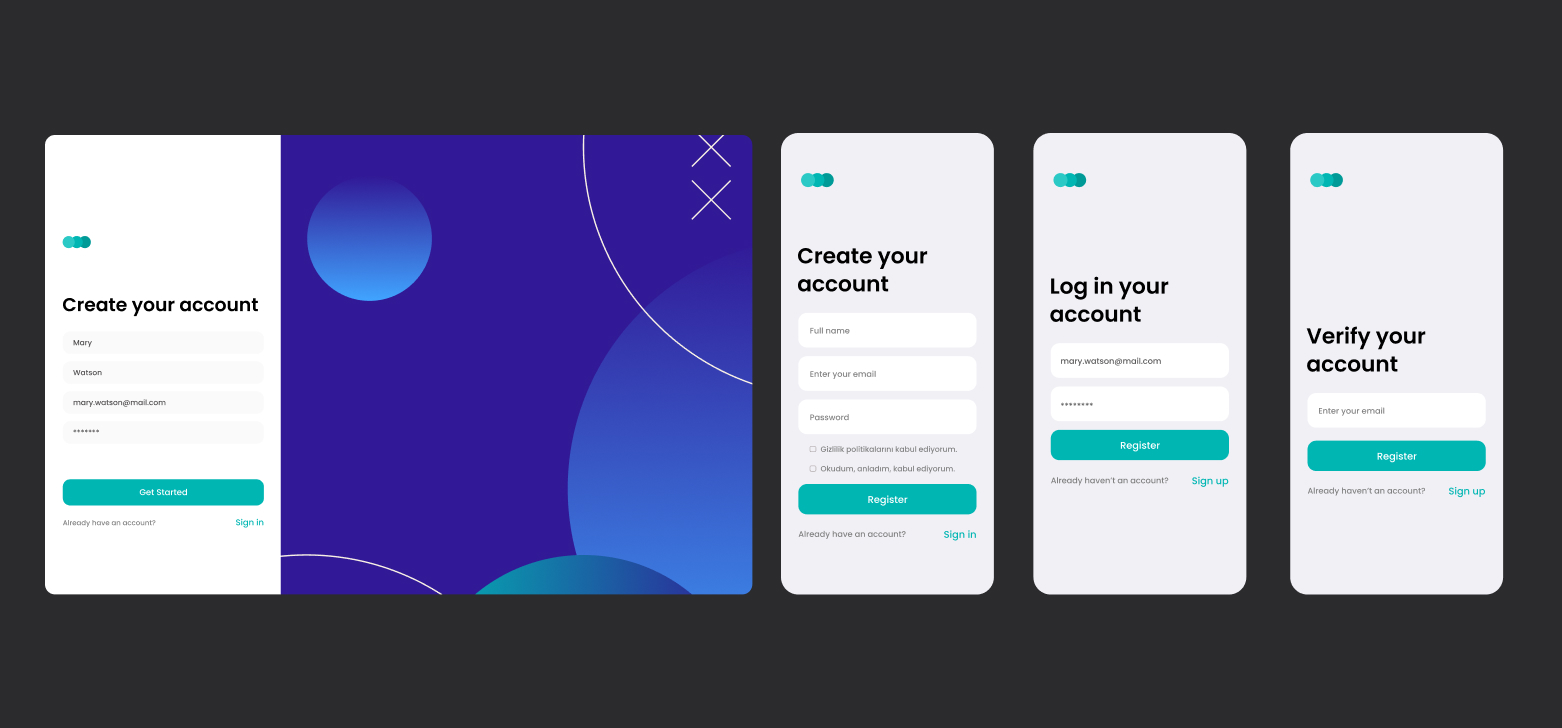
It is a series of screens where users log in after registering to Bir Fikrim Var application and can renew their passwords if they forget them. They can also change the information received during registration and more from the My Profile screen.
HomePage
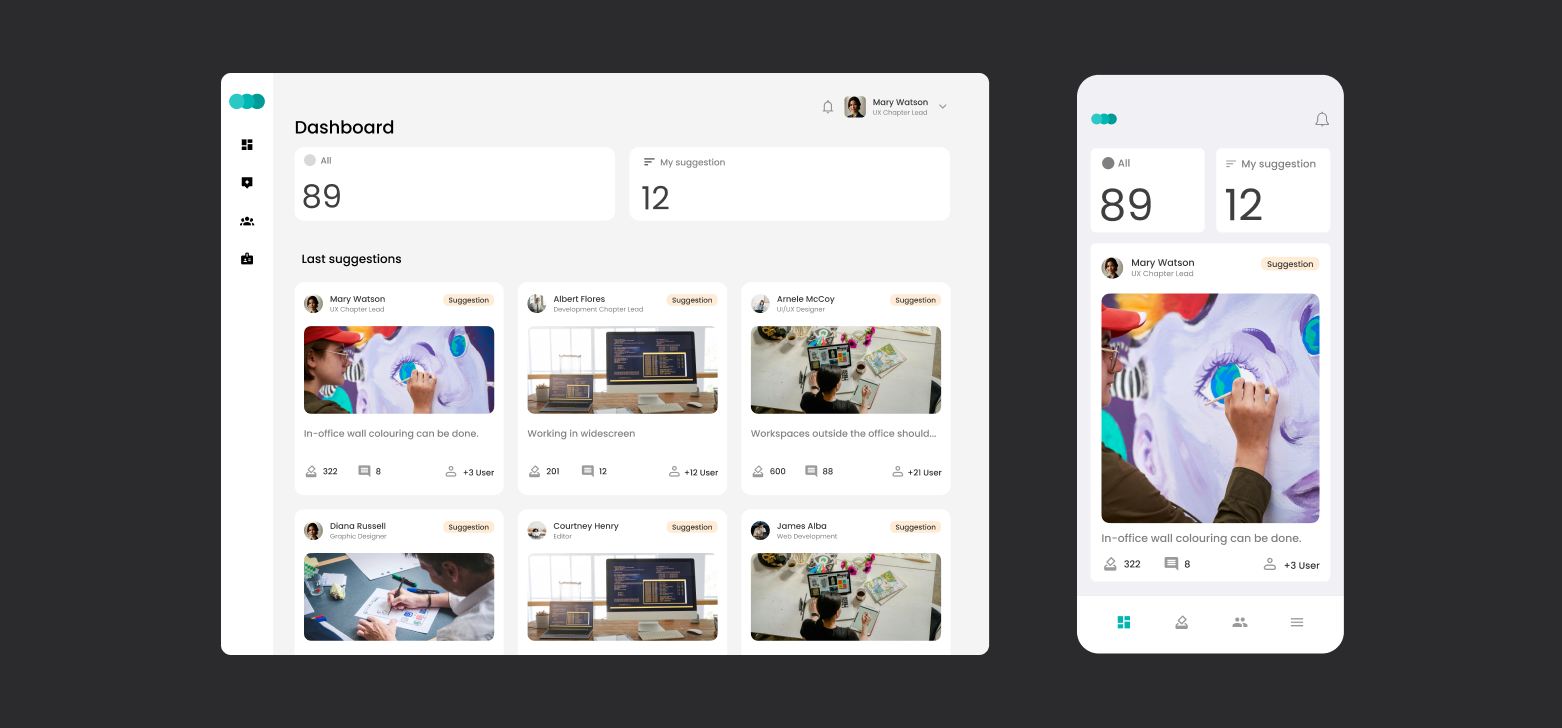
Dashboard is the initial screen after the user logs in. This is a central hub where users can access basic functions such as sharing ideas, voting and reviewing existing ideas.
Idea Sharing Screen
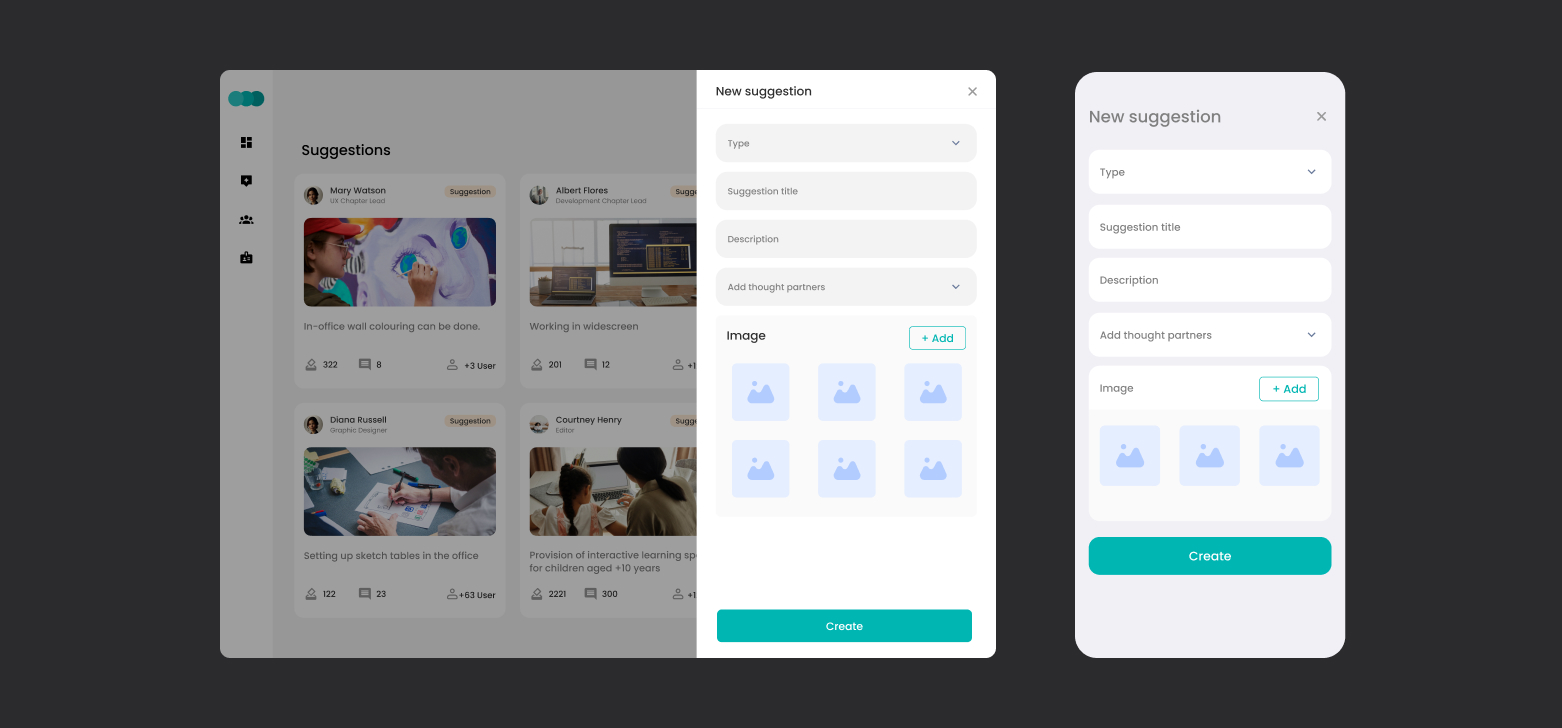
When users click on the “Share Idea” button on the main screen, they are directed to a form where they can detail their ideas. This screen includes fields where the idea title, category, description, image and idea partner can be selected.
Voting and Commenting with the Idea Detail Screen
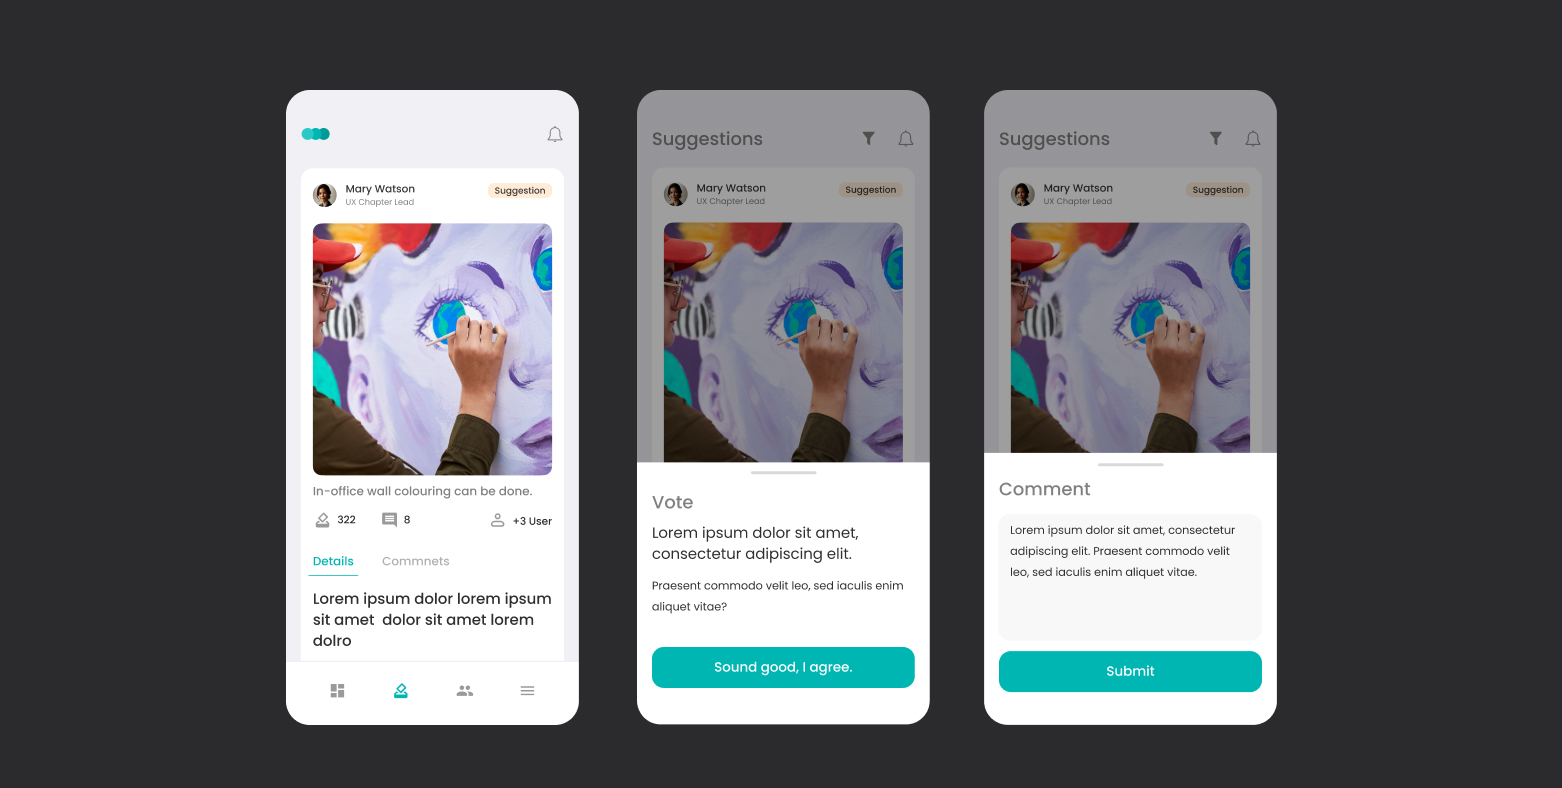
The details of each idea are shown on a separate screen. This includes a full description of the idea, available votes, comments and author information. Users can vote and comment directly from this screen.
My Profile Screen
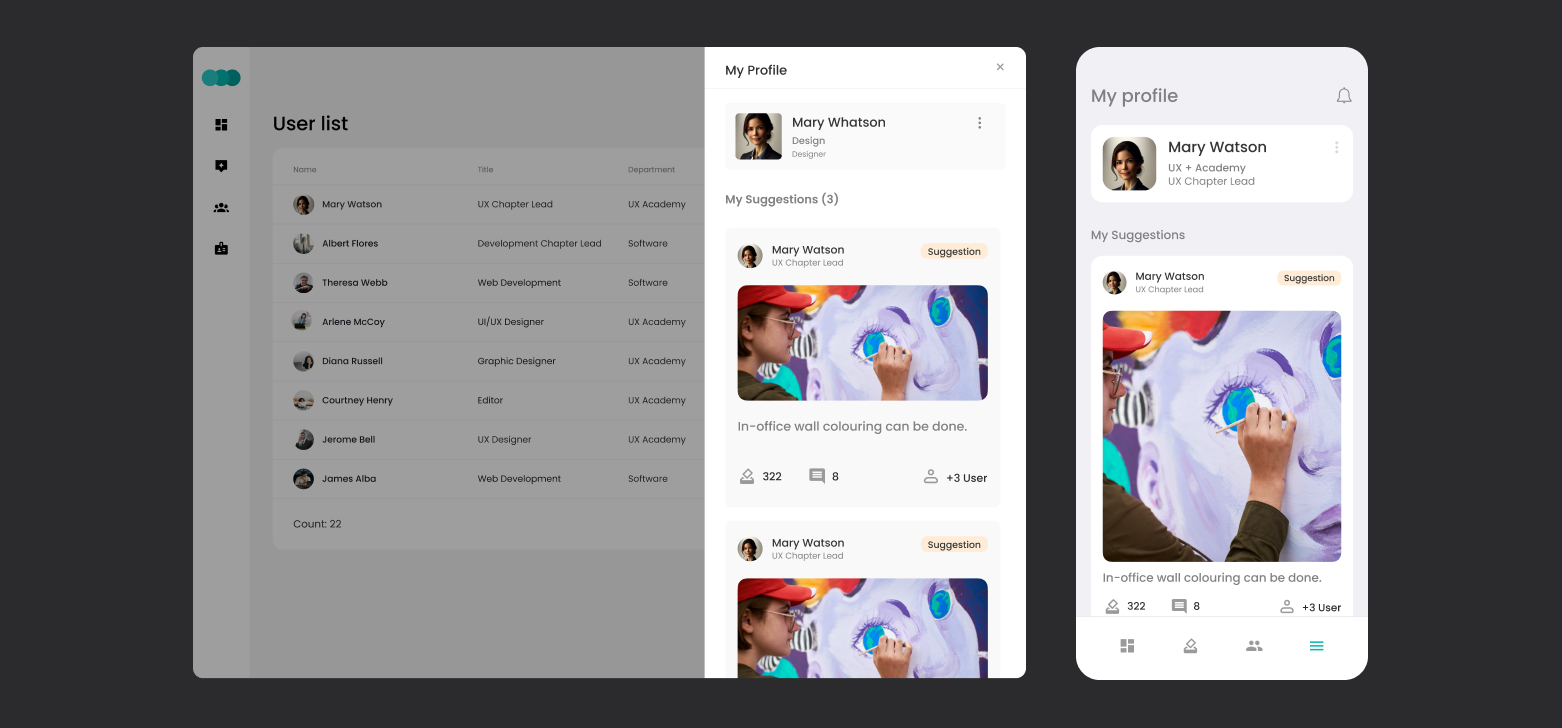
Users can view or edit user information in the application through this screen. They can also list the comments they have added.
Users and Department List
The system administrator can list the users registered in the application, inactivate them, edit information such as department and title.
Phase #2 Screens
In the second phase of the project, a workflow will be added to the application and screens will be added for the approval of the added ideas, their transformation into tasks after voting and their finalization.
Result
This flow chart visualizes the flow between screens of the “I Have an Idea” project. It is designed for users to have a smooth experience within the application.
Heading 1
Heading 2
Heading 3
Heading 4
Heading 5
Heading 6
Lorem ipsum dolor sit amet, consectetur adipiscing elit, sed do eiusmod tempor incididunt ut labore et dolore magna aliqua. Ut enim ad minim veniam, quis nostrud exercitation ullamco laboris nisi ut aliquip ex ea commodo consequat. Duis aute irure dolor in reprehenderit in voluptate velit esse cillum dolore eu fugiat nulla pariatur.
Block quote
Ordered list
- Item 1
- Item 2
- Item 3
Unordered list
- Item A
- Item B
- Item C
Bold text
Emphasis
Superscript
Subscript
In this learning content, we will examine the process of preparing a flow chart for the “I Have an Idea” project that describes the flow between screens and how users will navigate through the application.
Registration / Login Screens
It is a series of screens where users log in after registering to Bir Fikrim Var application and can renew their passwords if they forget them. They can also change the information received during registration and more from the My Profile screen.
HomePage
Dashboard is the initial screen after the user logs in. This is a central hub where users can access basic functions such as sharing ideas, voting and reviewing existing ideas.
Idea Sharing Screen
When users click on the “Share Idea” button on the main screen, they are directed to a form where they can detail their ideas. This screen includes fields where the idea title, category, description, image and idea partner can be selected.
Voting and Commenting with the Idea Detail Screen
The details of each idea are shown on a separate screen. This includes a full description of the idea, available votes, comments and author information. Users can vote and comment directly from this screen.
My Profile Screen
Users can view or edit user information in the application through this screen. They can also list the comments they have added.
Users and Department List
The system administrator can list the users registered in the application, inactivate them, edit information such as department and title.
Phase #2 Screens
In the second phase of the project, a workflow will be added to the application and screens will be added for the approval of the added ideas, their transformation into tasks after voting and their finalization.
Result
This flow chart visualizes the flow between screens of the “I Have an Idea” project. It is designed for users to have a smooth experience within the application.

Files

Sources

Glossary
