Kuika's Vision Actions feature allows you to integrate real-time image processing and computer vision capabilities into your applications.
With this module, you can create scenario-based visual processing pipelines such as object detection, tracking, segmentation, region analysis, and data logging via video streaming.
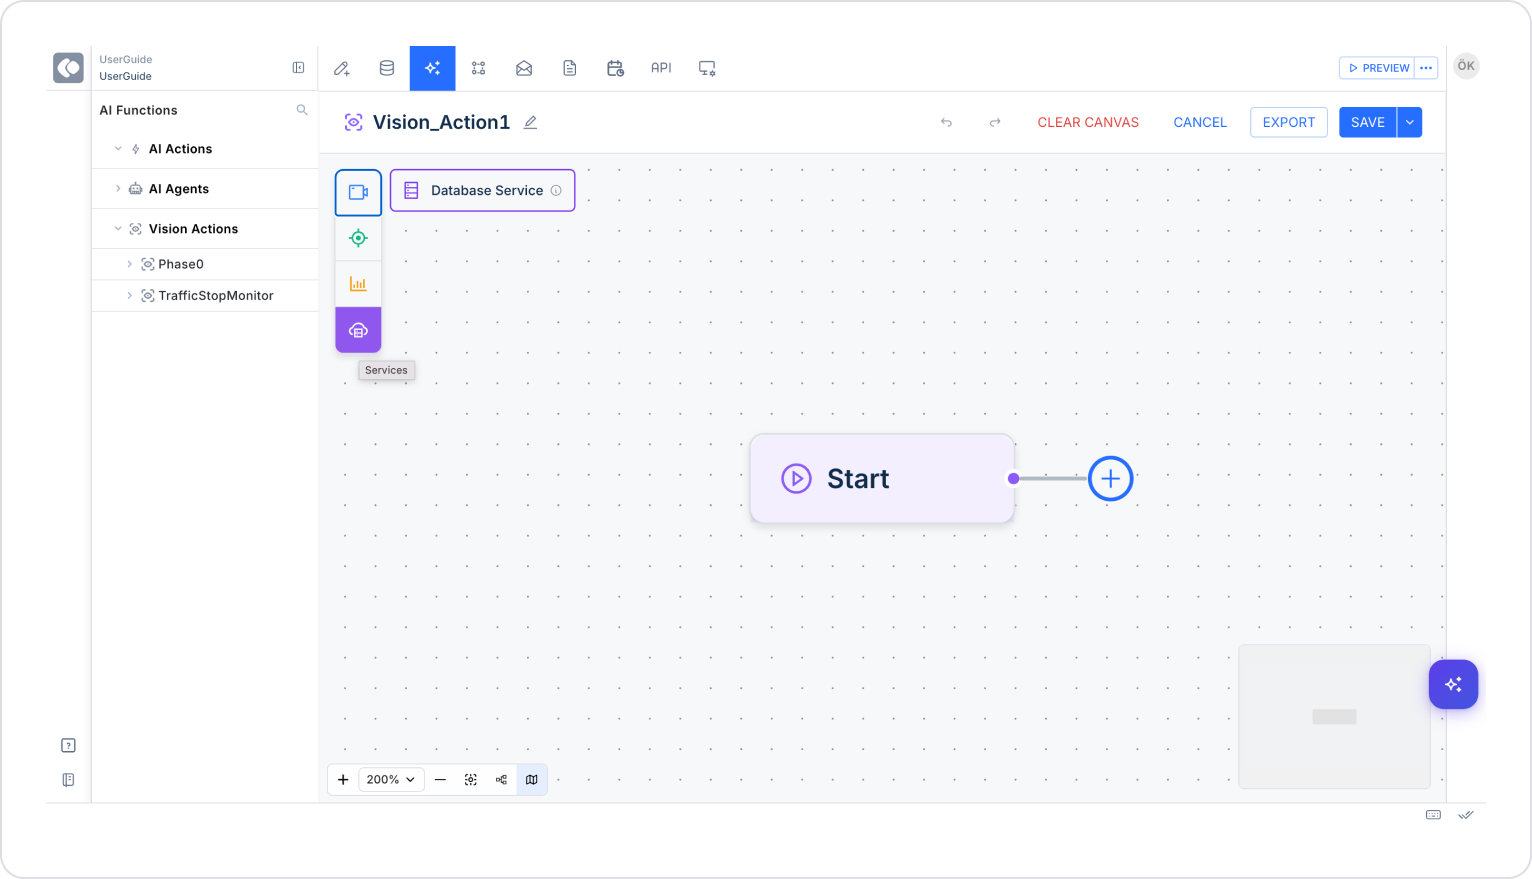
Vision Actions works with a drag-and-drop visual flow design and has a modular node structure.
Steps to Create a Vision Action
Log in to the Kuika platform.
Open the project you want to work on.
Go to the AI module.
Select the Vision Actions section.
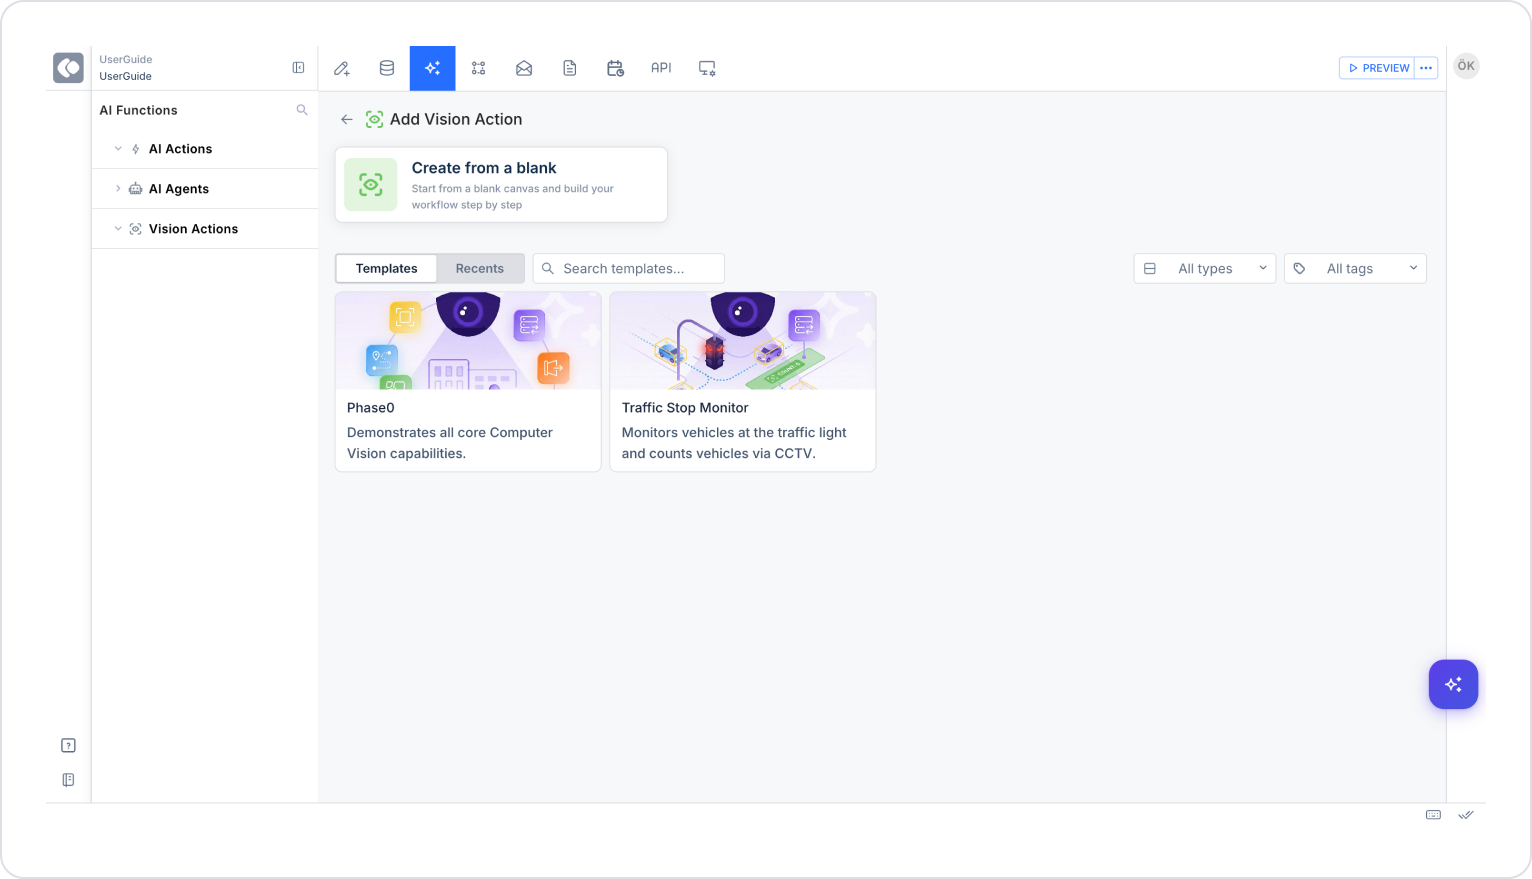
You can choose a ready-made template or create a workflow from scratch using Create from a blank.
Vision Action Template Options
There are ready-made scenario templates within Vision Actions.
Phase 0
Phase 0 is a simple template designed to test the Phase 0 Nodes in the Vision Actions module. This flow only detects and tracks human and vehicle objects and logs timestamps. Therefore, the template can be called “Object Tracker & Logger” for demonstration purposes.
Usage Scenario
Reference pipeline for users trying the Vision infrastructure for the first time
Developers who want to see how node types are connected
Testing model parameters
Measuring performance and latency
Performing database connection verification
Testing analytics event generation
Phase 0 is used to observe all the technical capabilities of the system rather than for production scenarios.
Content and Technical Flow
The pipeline consists of the following components:
Video Input
Provides the image source.
Local video file
IP camera
RTSP stream
Output: Frame-based image stream
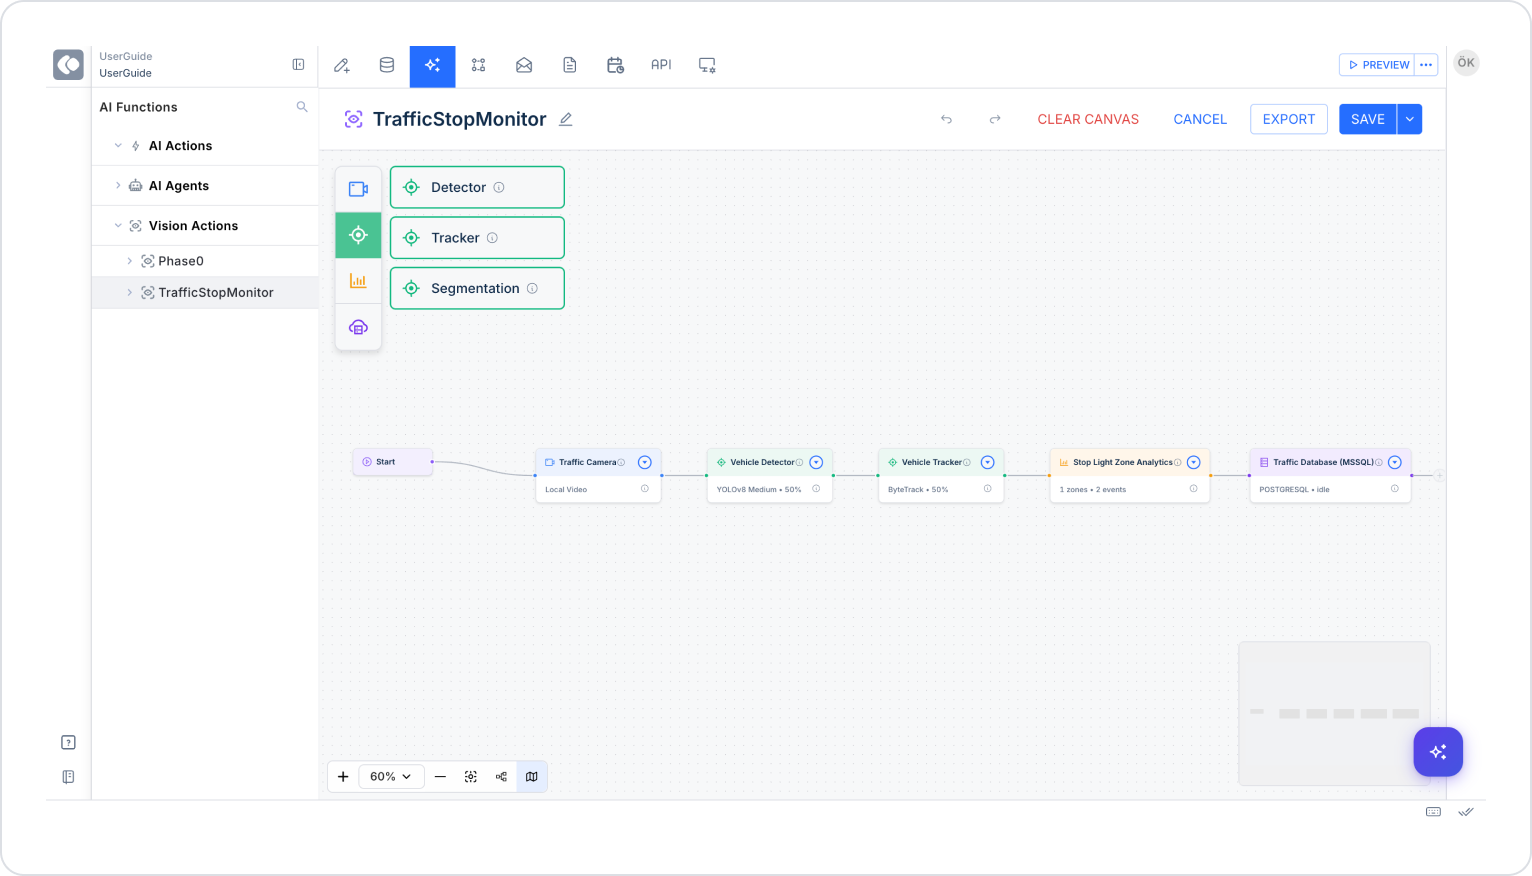
Object Detector
Detects objects on the frame. The YOLOv8 model family is commonly used.
Generated data:
Bounding box coordinates (x, y, width, height)
Confidence score
Class label (car, person, truck, etc.)
Object Tracker
Tracks detected objects between frames. The ByteTrack algorithm is typically used.
Generated data:
Unique tracking ID
Frame continuity
Object movement direction
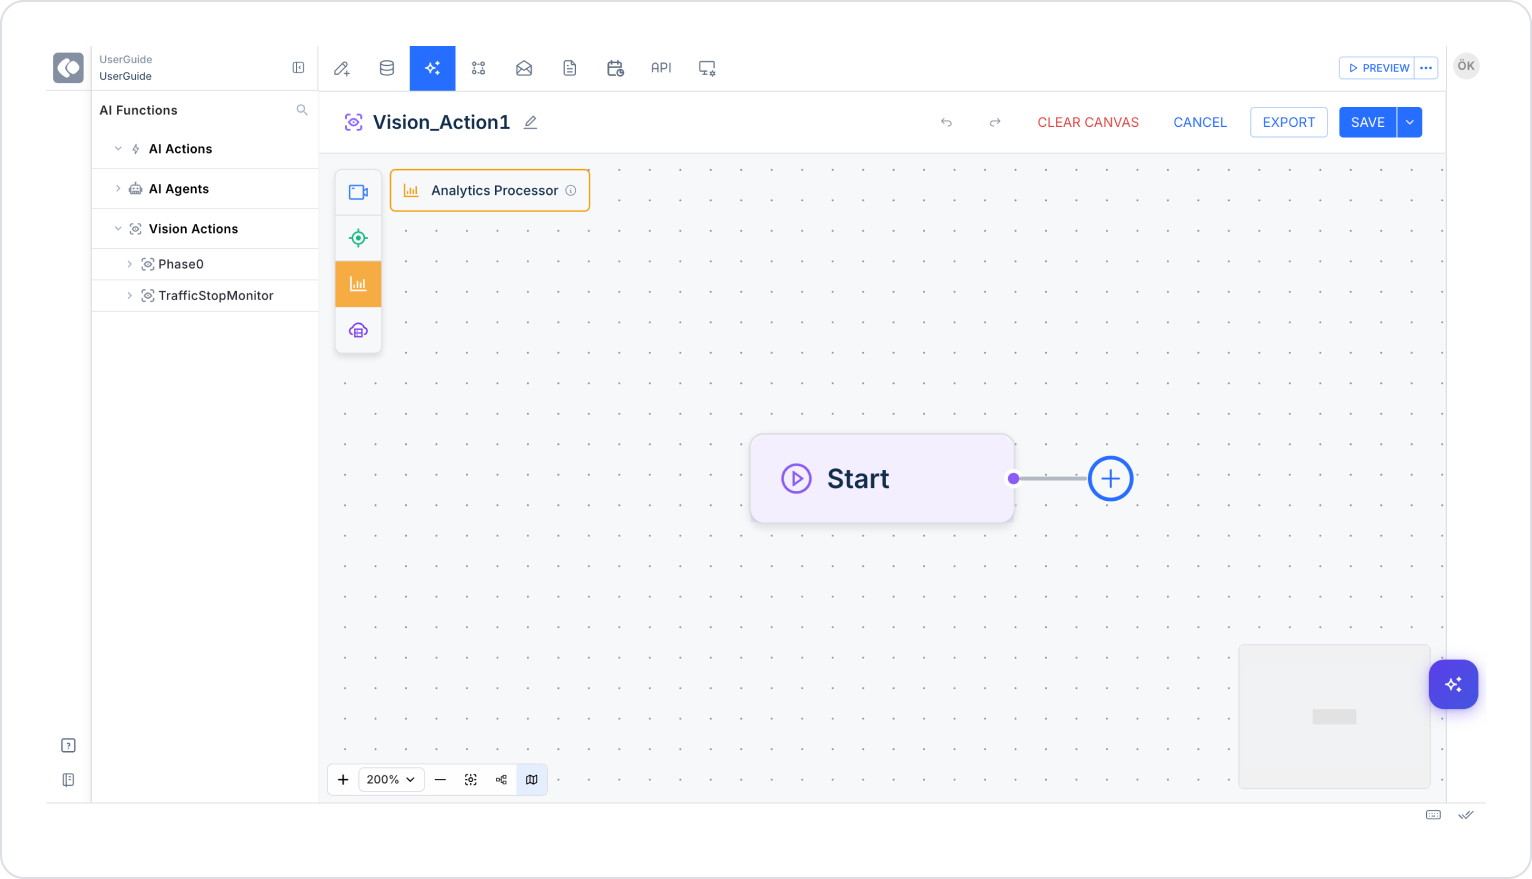
Analytics Processor
Rules-based analysis is performed on detected and tracked objects.
Example analyses:
Total number of vehicles
Number of people in the frame at the same time
Time spent in a specific area
Event generation (zone enter/exit)
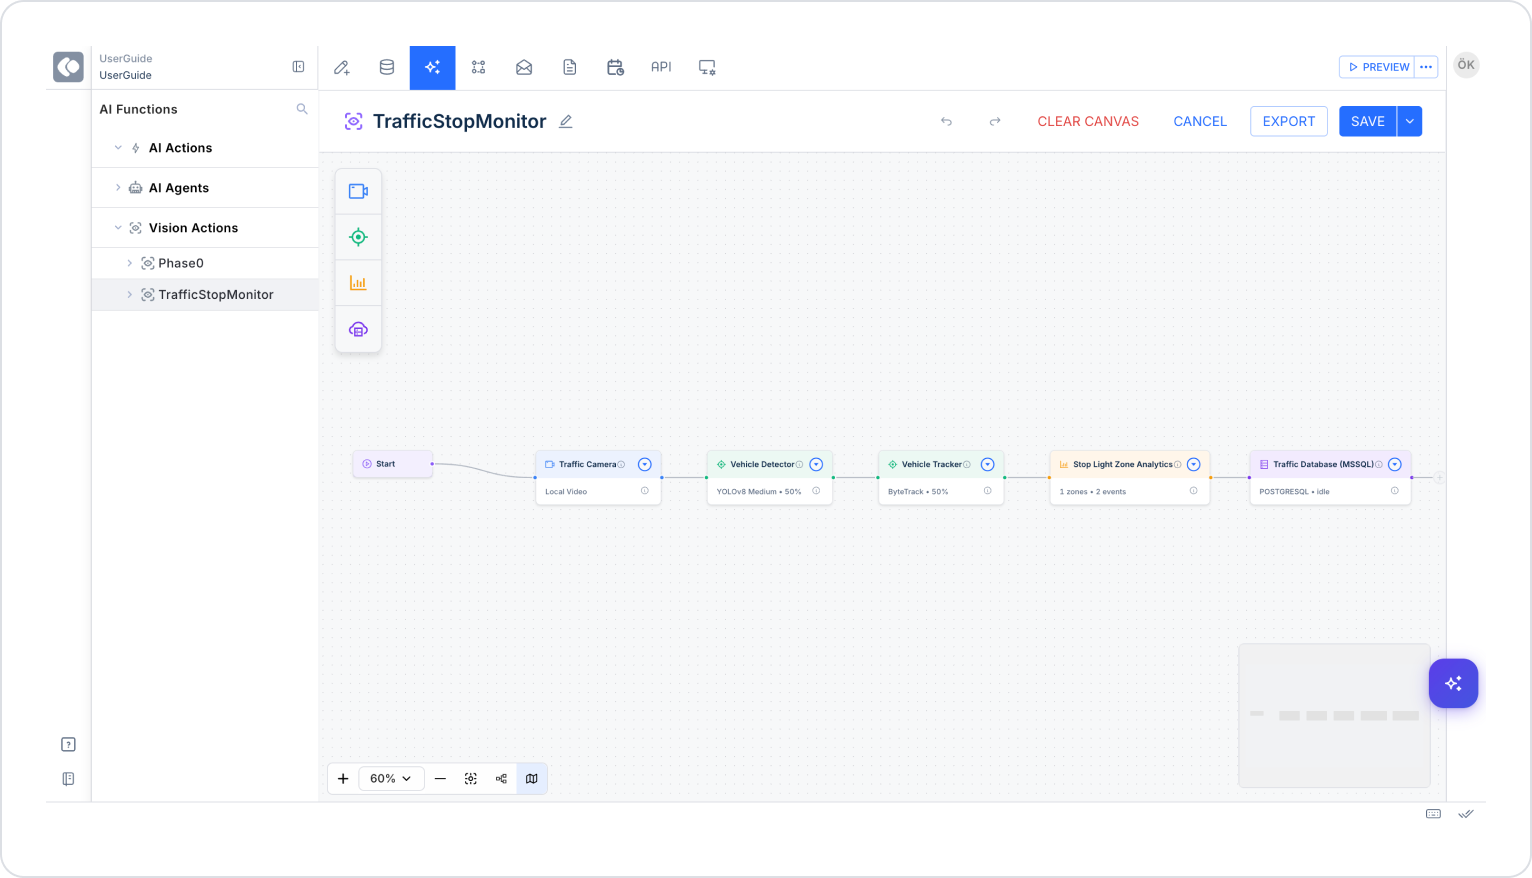
Database Service
The generated analysis outputs are stored in the database.
Traffic Stop Monitor is a scenario-based Vision pipeline that detects and tracks vehicles via a CCTV camera monitoring traffic lights and performs rule-based analysis in specific zones.
This template is specifically designed for smart city applications such as traffic density and violation detection.
Usage Scenario
Smart city infrastructure
Traffic density analysis
Intersection-based vehicle counting
Red light violation detection
Stop line violation
Lane violation analysis
Technical Flow
Video Input
Live images are captured via CCTV or IP camera.
Object Detector
Vehicle classes are detected on the frame.
Typically:
car
bus
truck
motorcycle
For each vehicle:
Bounding box
Confidence
Class information is generated.
Object Tracker
Each vehicle is assigned a unique ID and tracked across frames.
This ensures:
The same vehicle is not counted repeatedly,
The direction of vehicle movement is determined,
Zone entry/exit is analyzed.
Zone Analytics
Specific areas (zones) are defined:
Stop line
Pedestrian crossing
Intersection area
The analytics engine generates the following events:
zone_enter
zone_exit
dwell_time
violation_event
Example rule:
If:
trafficLight = RED
AND
vehicle enters stop_zone
THEN
violation = true