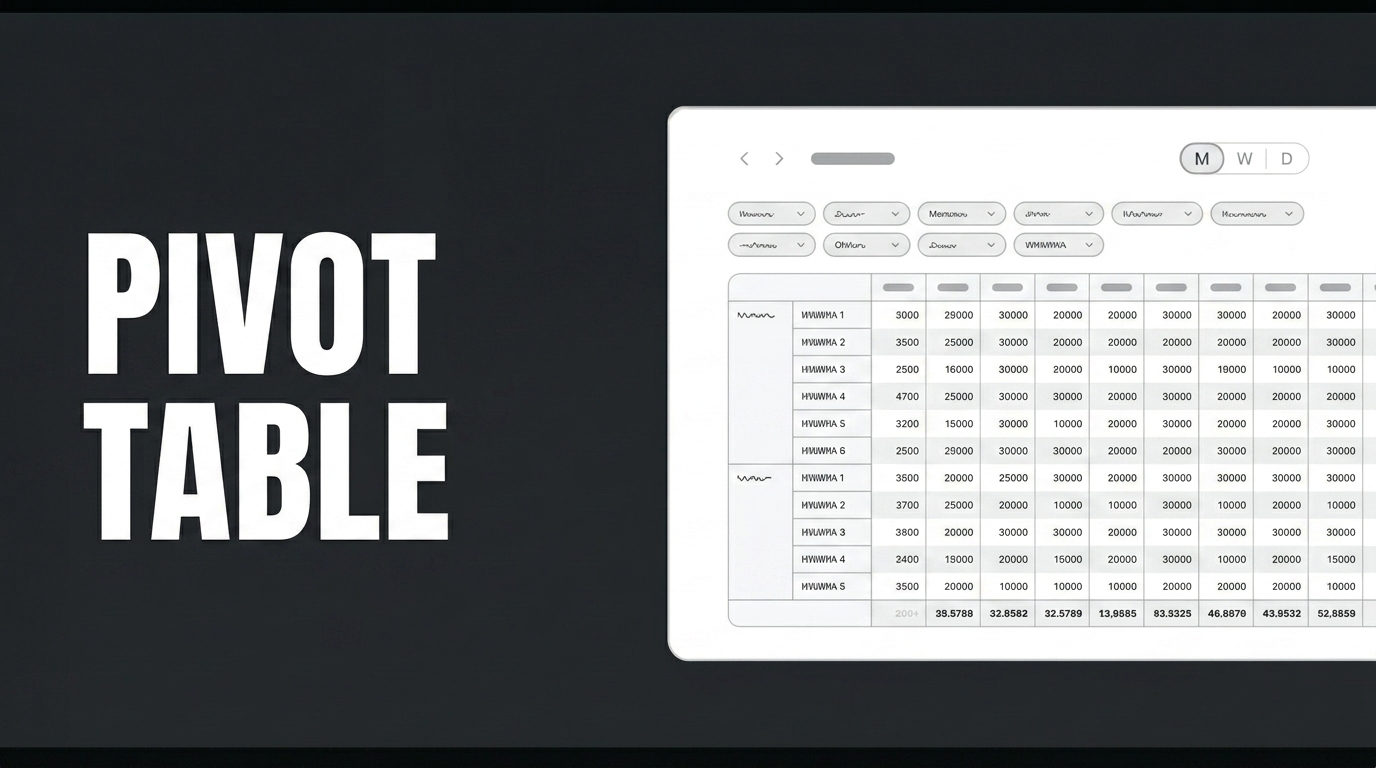
The Pivot Table feature offers a flexible reporting environment by allowing you to break down large data sets into rows and columns using drag-and-drop, and instantly summarize them using calculation modes such as Sum, Maximum, or Count.
If you want to dynamically summarize your large and complex datasets and provide your users with a flexible reporting environment, the most powerful solution is to use the Pivot Table element. In many areas—from financial analysis to sales performance tracking—you can easily break down your data by row and column.
In this video, we’ll examine an example of using this element through the Restaurant Invoice Analysis Scenario. First, add the action that retrieves the sample data named “RestaurantBills” from the Data Sources area. Test it and save it. Then, from the Add Action area, connect the “RestaurantBills” action—which is your Initial Action query to retrieve the data—to the page. Next, drag the Pivot Table element onto the screen and define this action in the DataSource field of the Properties panel. Once the table is loaded, you can drag and drop the row, column, and metric fields onto the axes and instantly apply calculation modes such as Sum, Maximum, or Count.