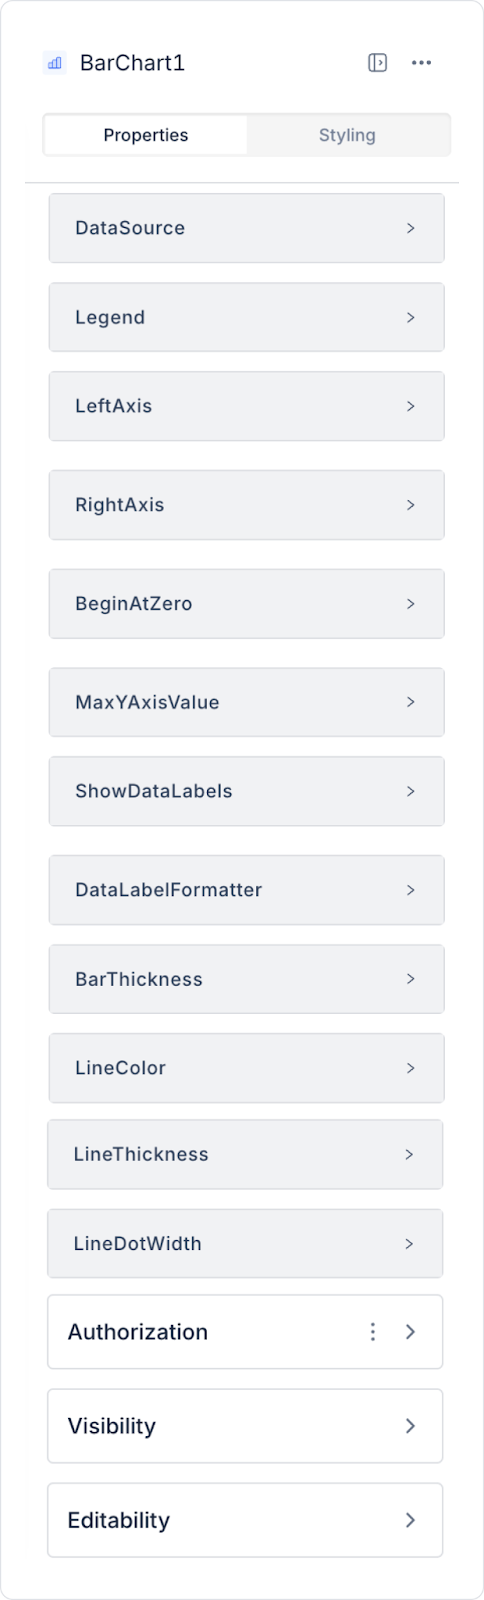
You can configure the following settings in the Properties panel:
Data Source:
Select the data field you want to display from the Action field.
The following data settings cannot be displayed when you have not added an action to the Datasource.
Data Label: Determines the data label to be displayed on the chart.
Tooltip Custom Title Data Label: Sets the data label to appear in the Tooltip title.
Tooltip Custom Content Data Label: Descriptive data label to be shown in the Tooltip content.
Multi Tooltip Content Fields: Allows you to show more than one data field in the tooltip.
Target Line Field: Specifies the data field to be used to show a target line.
Data Field: This is the field where you define the main data series.
Data Bg Color: Specifies the background color of the main data field.
Second Data Field: Used to define a second data series on the chart.
Second Data Bg Color: Sets the background color of the second data series.
Third Data Field: Used to add a third data series.
Data Bg Color: Sets the background color of the third data series.
Legend: Show your data in the top, bottom, right or left fields of the chart.
Left Axis: Set whether to show or hide values on the Y axis.
Right Axis: Set to show or hide values on the X axis.
Begin At Zero: The chart uses the smallest data value as the starting point.
Max Y Axis Value: Set the maximum value to show on the Y axis.
Show Data Labels: Show the data labels by turning on the Switch button.
Data Label Formatter: Allows you to display data labels in Money, Money TI, Percent, Fractional-2, Fractional-5 formats.
Bar Thickness: Allows you to adjust the thickness of the chart bars.
Line Color, Line Thickness, Line Dot Width: Settings for the color, thickness, and dot width of line elements on the graph. Available only in web applications.
Show Line Label: Enables the display of labels on lines. (Available only in web applications.)
Line Label Color: The color of the line label. Available only in web applications.
Line Label Position: The position of the line label. Available only in web applications.