Report Table is an element used within Report Designer to display information from dynamic data sources in table format. The number of rows is automatically generated based on the data received from the connected datasource, and the table content is dynamically updated as the data changes.
Report Table is designed for data-driven reports and is particularly used in listing, summarizing, and reporting scenarios.
The Report Table is suitable for scenarios such as transaction lists, invoice statements, user records, order lists, and date-based reports.
When Should the Report Table Be Used?
The Report Table is preferred in the following situations:
If the table content will change dynamically
If the data comes from an SQL query, service, or process output
If the number of rows is not fixed in advance
If listing is to be done in PDF or print output
If manual cell merging is not required
For dynamic data lists, Report Table is recommended, while Static Table is recommended for fixed and design-controlled tables.
Adding a Report Table
Select the Report Table element from the Elements Panel.
Drag the element and drop it onto the Canvas.
When selected, the Report Table is displayed on the Canvas with its default table structure.
Report Table Prerequisites
For the Report Table to work correctly and generate output, the following actions must be added to the UI Designer module in sequence:
The Get Report Base64 action must be added. This ensures that the report's data and design information is generated in Base64 format.
Then, one of the following actions must be added to obtain the report output:
Print PDF
Download PDF
As long as these actions are not defined, the Report Table:
Will not be displayed in the PDF output,
Will not work in print or download scenarios.
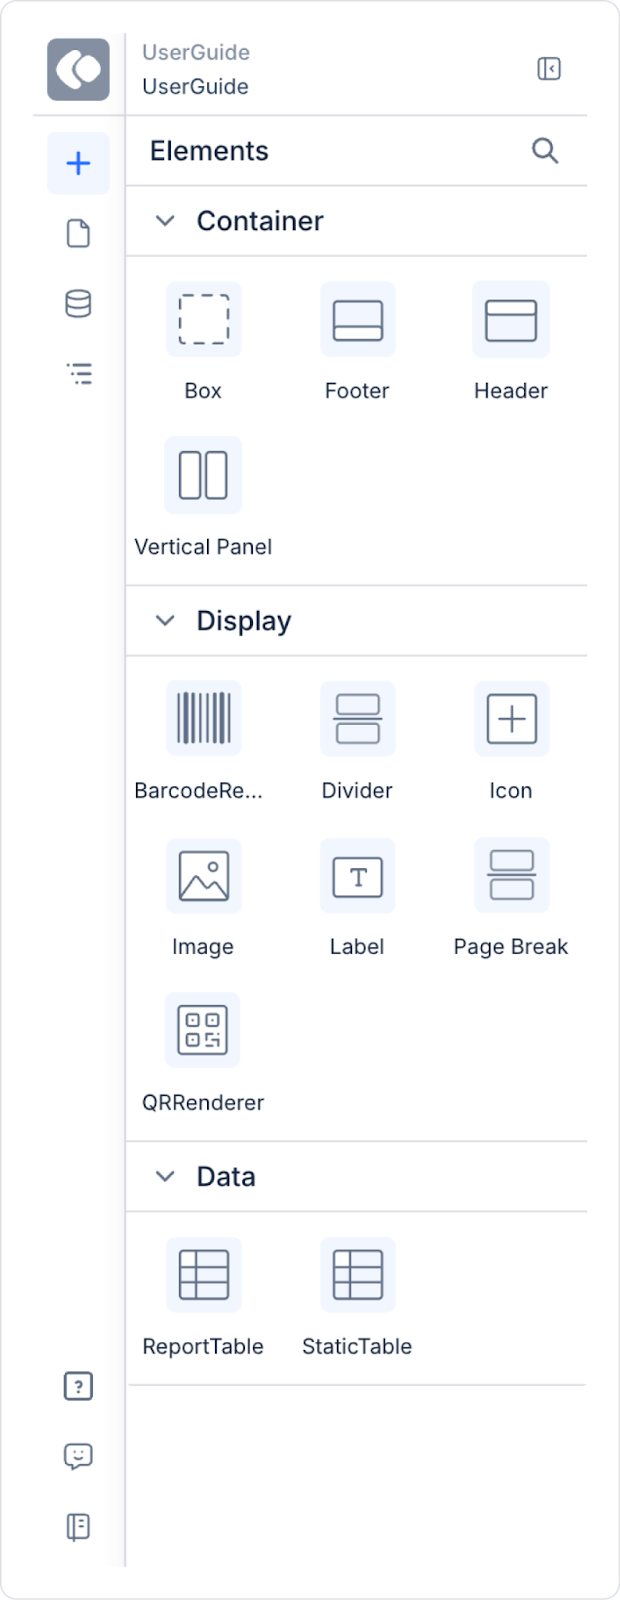
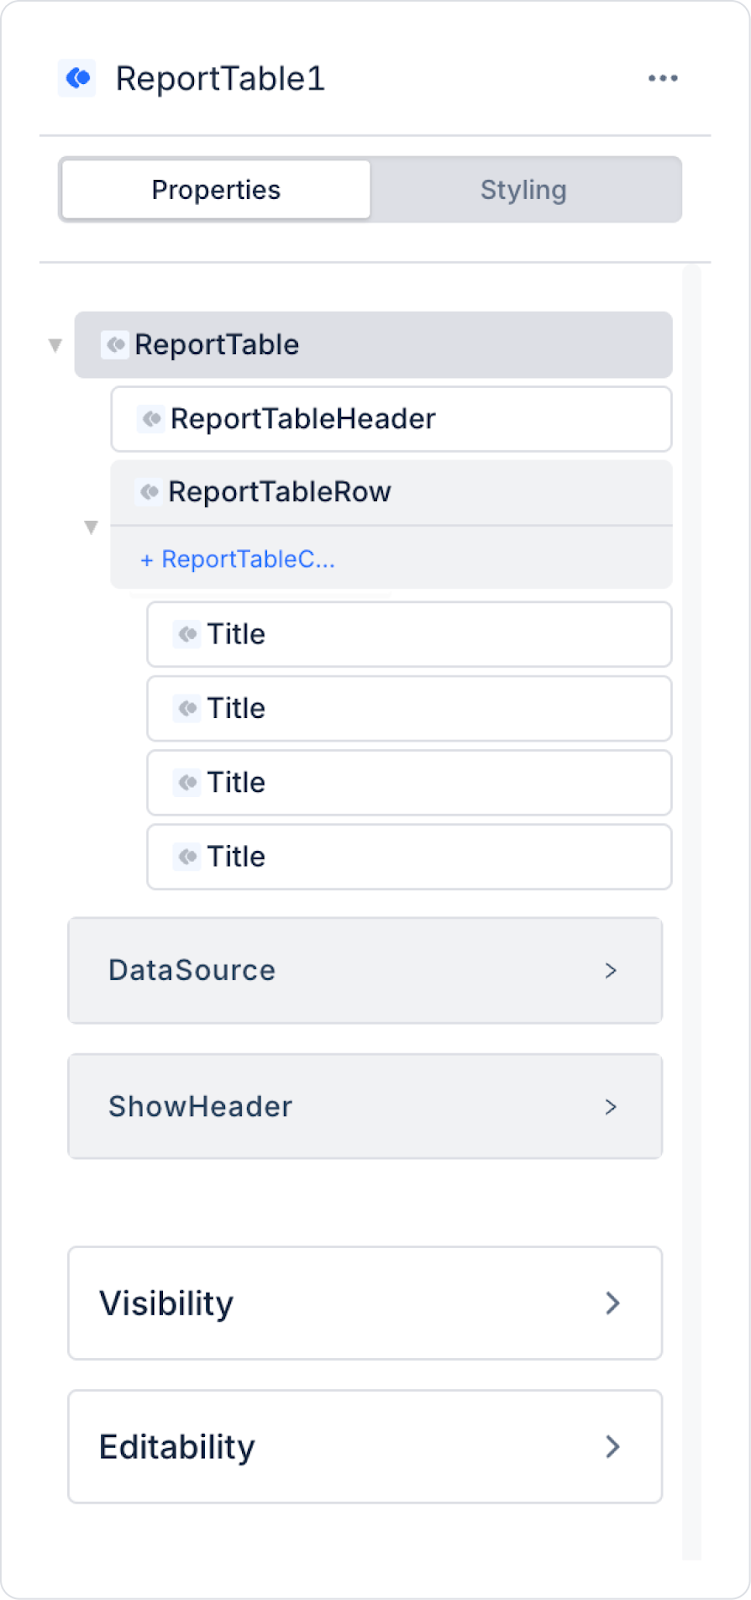
Report Table Properties Panel
All settings for the Report Table are managed through the Properties Panel. This panel contains general settings for the table, header properties, and column-based configurations.
Datasources
Determines which data source the Report Table will be fed from.
The Report Table is rendered with data only when a datasource is defined.
SQL queries, service outputs, or process results can be used as datasources.
When a datasource is selected, the table rows are automatically created based on the incoming data set.
Show Header
Determines whether the table header row is displayed.
On: Column headers are displayed.
Off: Only data rows are displayed.
Striped
Enables table rows to be displayed in a striped (alternating row) pattern.
It is used specifically to improve readability in tables with many rows.
When enabled, table rows are displayed with alternating background colors.
Striped Color
Specifies the alternating row color used when the Striped feature is enabled.
This setting allows a different background color to be applied to every other row.
It makes it easier to distinguish rows in tables containing dense data.
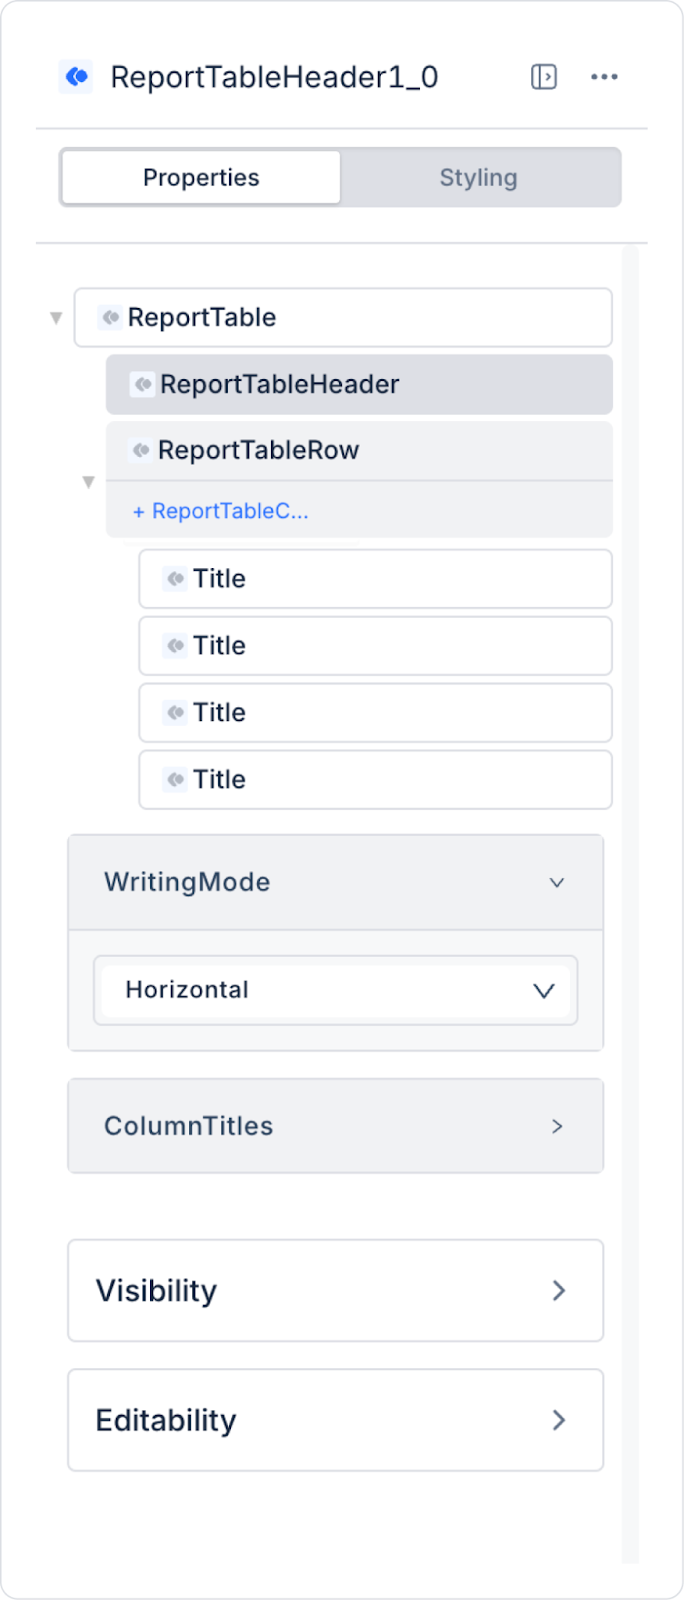
Report Table Header Properties
Report Table Header refers to the header area at the top of the table. These settings only apply when the Show Header is active.
Writing Mode
Determines the writing direction of column headers.
Supported modes:
Horizontal: Text is written from left to right.
Vertical: Text is displayed vertically.
Can be used for easier reading of headers in narrow columns.
Column Titles
This is where the header text for each column is defined.
Headers can be set manually.
They are independent of the Datasource field names.
This allows for the creation of user-friendly and meaningful headers.
Header Border
You can configure border settings for the report table header area.
With this feature:
You can customize the appearance of the lines in the header row.
You can change the border color.
You can adjust the border thickness.
Header border settings make table headers stand out more clearly from the data rows and improve readability, especially in reports containing large amounts of data.
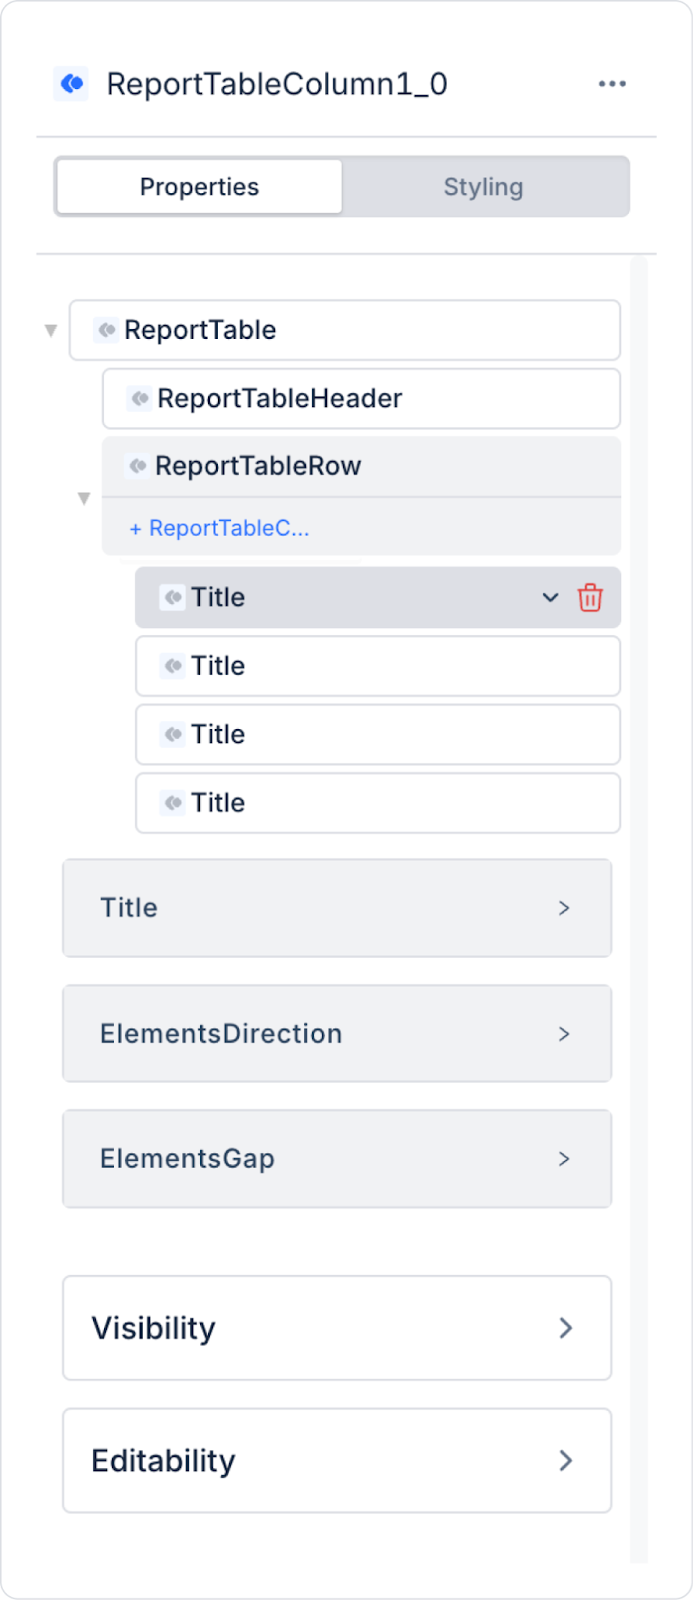
Report Table Column Properties Panel
When a column is selected in the Report Table, its settings are managed via the Properties Panel. The layout and visual behavior of the column are controlled by these settings.
Title
Specifies the title text for the selected column.
Displayed when Show Header is enabled.
Can be edited independently of the datasource field name.
Elements Direction
Specifies the placement direction for multiple elements added to a column.
Supported directions:
Horizontal: Elements are placed side by side.
Vertical: Elements are placed one below the other.
Used when multiple Labels are used in a column or when header-value structures are to be created.
Elements Gap
Elements Gap controls the space between elements within a column.
Applied as horizontal spacing in Horizontal layout,
and vertical spacing in Vertical layout.
Used to improve readability in tables containing dense data.
Visual Editing (Styling)
Visual edits for Report Table are made via the Styling Panel.
Fill Color: The background color of the table or column can be adjusted.
Border: Table borders can be enabled, and their color and thickness can be adjusted.
Report Table Usage Scenario
In a reporting or accounting application, a table-based invoice list is used so that users can track generated invoices through a report that is dynamically updated with data. This list allows the user to quickly analyze the invoice status by presenting the invoice records from the database in an organized and readable format on a single report page.
The invoice list displays critical fields such as invoice number, invoice date, recipient company information, invoice status, amount, and currency in columns. Each row is configured to represent a single invoice in the system. The table content is automatically generated based on the number of records from the connected data source, and the report content is updated as new invoices are added.
Users can review invoices from top to bottom via the report output. The invoice status field allows for clear differentiation between statuses such as “Paid” and “Overdue,” enabling quick analysis of which invoices are overdue. The table structure expands based on the data, eliminating the need for manual editing.
The Report Table creates the report while preserving the table structure and data layout when a PDF or download output is taken. This allows the user to export the invoice list seen on the screen in the same format and use it for reporting or sharing purposes.
In the scenario:
The invoice list is created within the report using the Report Table element.
The table content is fed with dynamic data from an SQL query or data source.
Each row represents a single invoice.
The invoice number, date, recipient company, status, amount, and currency information are displayed in columns.
The invoice status field allows easy distinction between paid and overdue invoices.
The number of rows is not fixed and changes automatically depending on the amount of data.
When the report output is taken, the table is created in PDF or file format while maintaining its current layout.
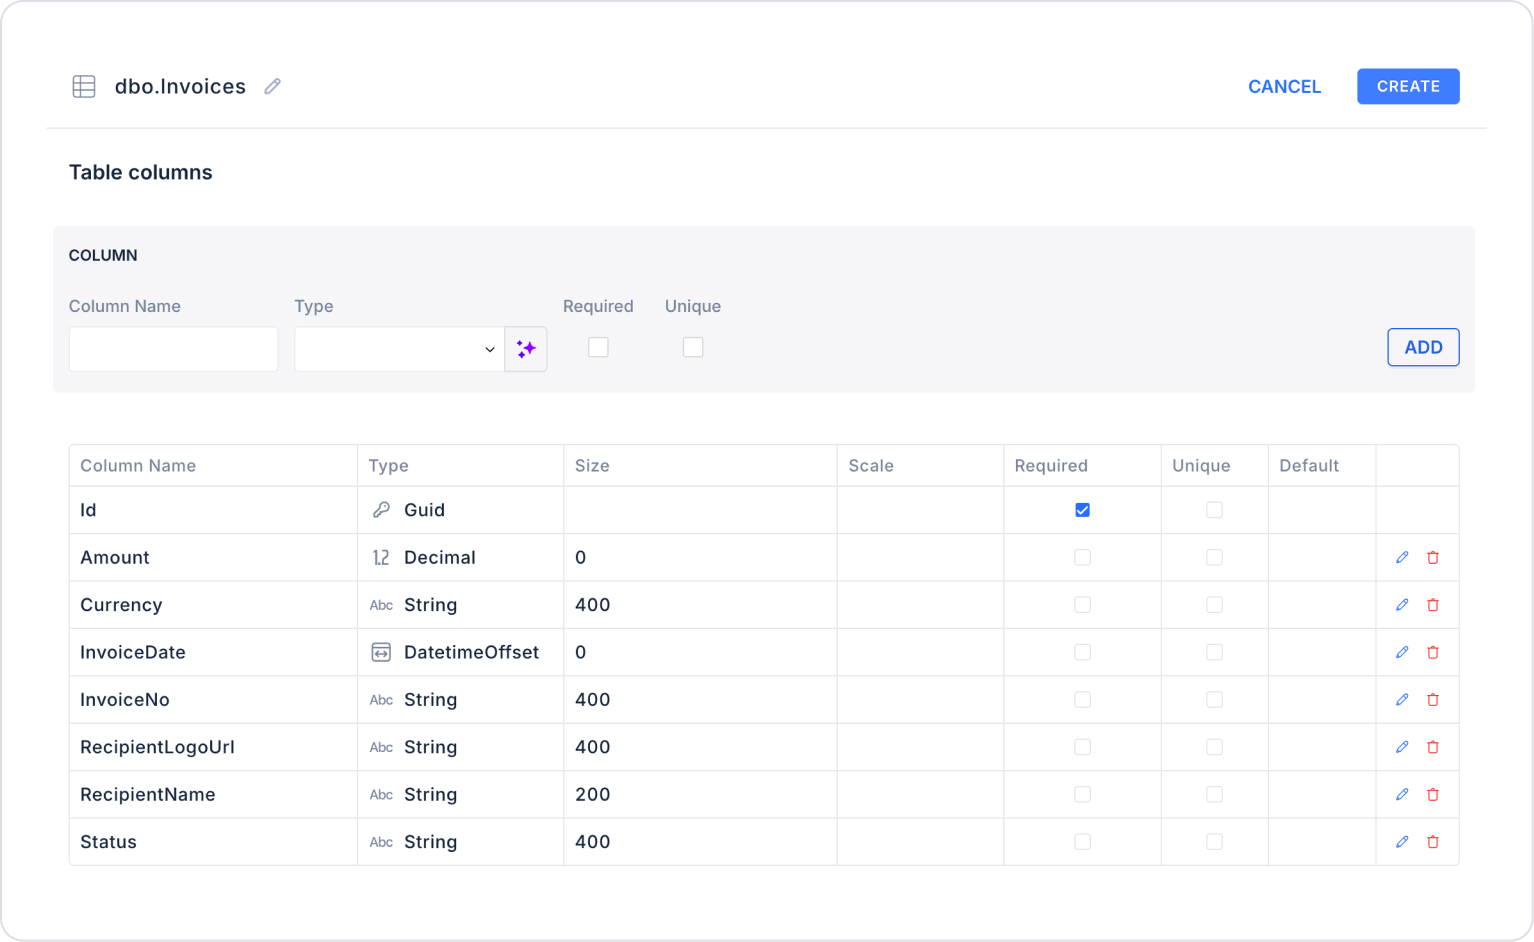
Step 1 - Creating a Data Source
Creating a table in the DataSources module:
Go to the Datasources module.
Then go to the Tables tab.
Create a new table named “Invoices”.
The table structure to be set up is as follows:
Important Field Names:
InvoiceNo: Represents the unique number of the invoice. It is the main reference information shown to the user in list and table views and allows the invoice to be quickly identified.
InvoiceDate: Holds the date the invoice was created or issued. Users use this field to sort invoices by date and make periodic comparisons.
RecipientName: Specifies the name of the recipient company or customer for whom the invoice was issued. It clearly shows in the invoice list who it was issued to.
RecipientLogoUrl: Contains the URL information for the logo or representative image of the recipient company. It provides visual support in the list rows, making it easier to distinguish invoices.
Status: Indicates the current status of the invoice (e.g., Paid, Overdue, Draft). It is an informative field that helps the user quickly analyze the payment status.
Amount: Specifies the total amount of the invoice. It provides the user with a numerical and comparable value, enabling them to assess the financial situation.
Currency: Indicates the currency in which the invoice amount is denominated (e.g., TRY, USD, EUR). It ensures that amounts are interpreted correctly in scenarios where multiple currencies are used.
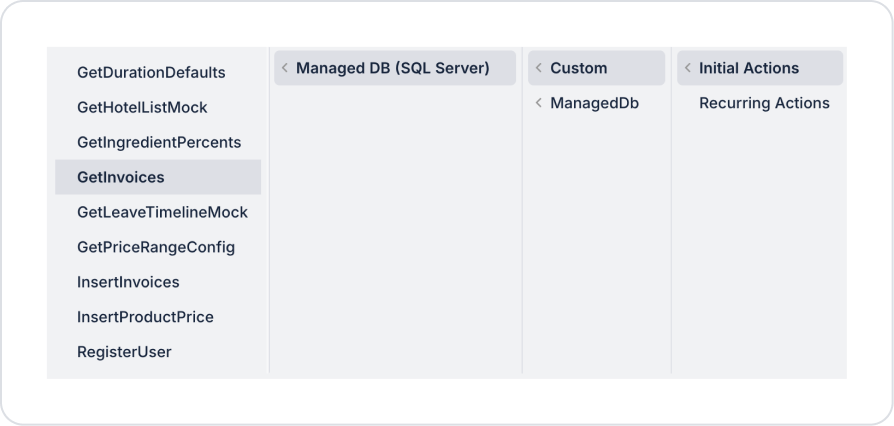
Step 2 - Defining the Necessary Actions
To display and add data in the interface:
You need to define two actions.
Add a new action from the Actions > New SQL Action tab in the Datasources module.
Action that Adds Sample Data (InsertInvoices): To test the application with sample data, add the following SQL action and press the TEST button.
Edit the column names in the Report Table Header > Column Titles field:
No
Date
Recipient
Status
Amount
Currency
For header display:
Set the Report Table Header > Writing Mode field to Horizontal (or Vertical if necessary).
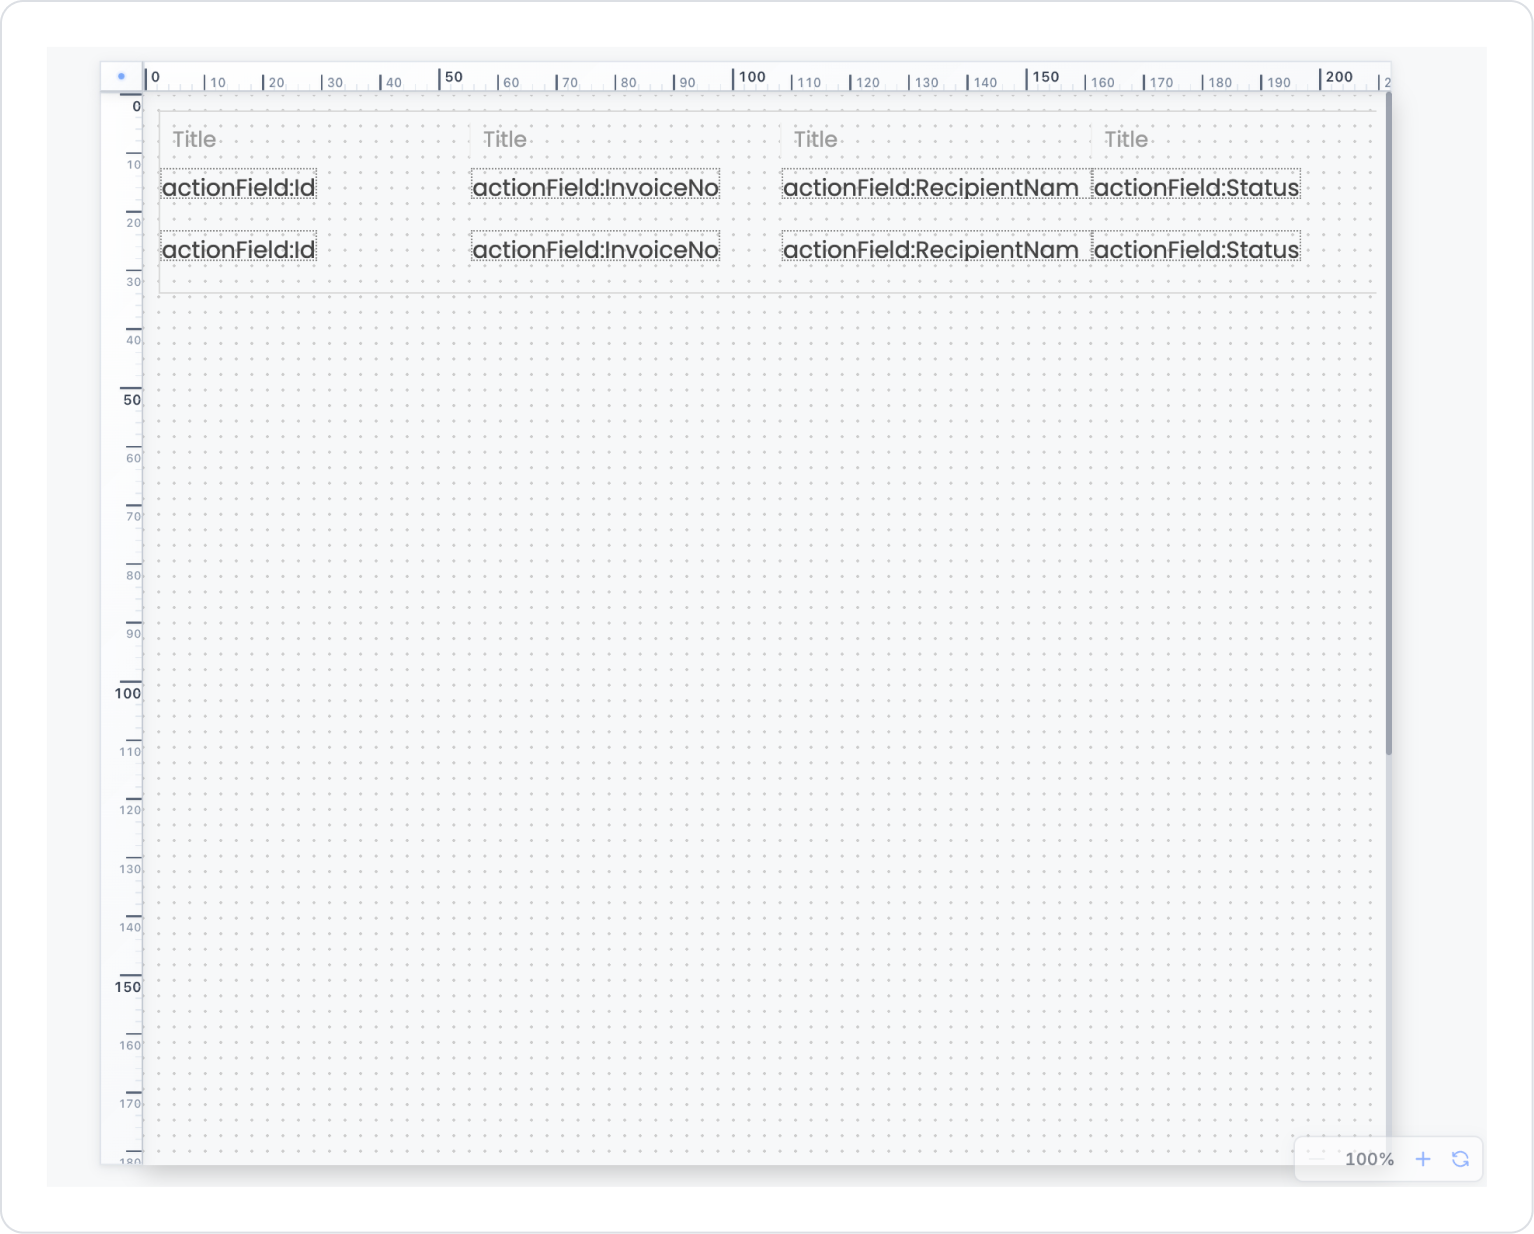
Step 6 – Editing Column Content (Elements Direction / Gap)
If you want to display more than one piece of information in a column:
Add two Labels to the Recipient column.
With the column selected:
Report Table Column > Elements Direction: Vertical
Report Table Column > Elements Gap: 8 px
Set these options.
This will display the amount and currency one below the other, making it more readable.
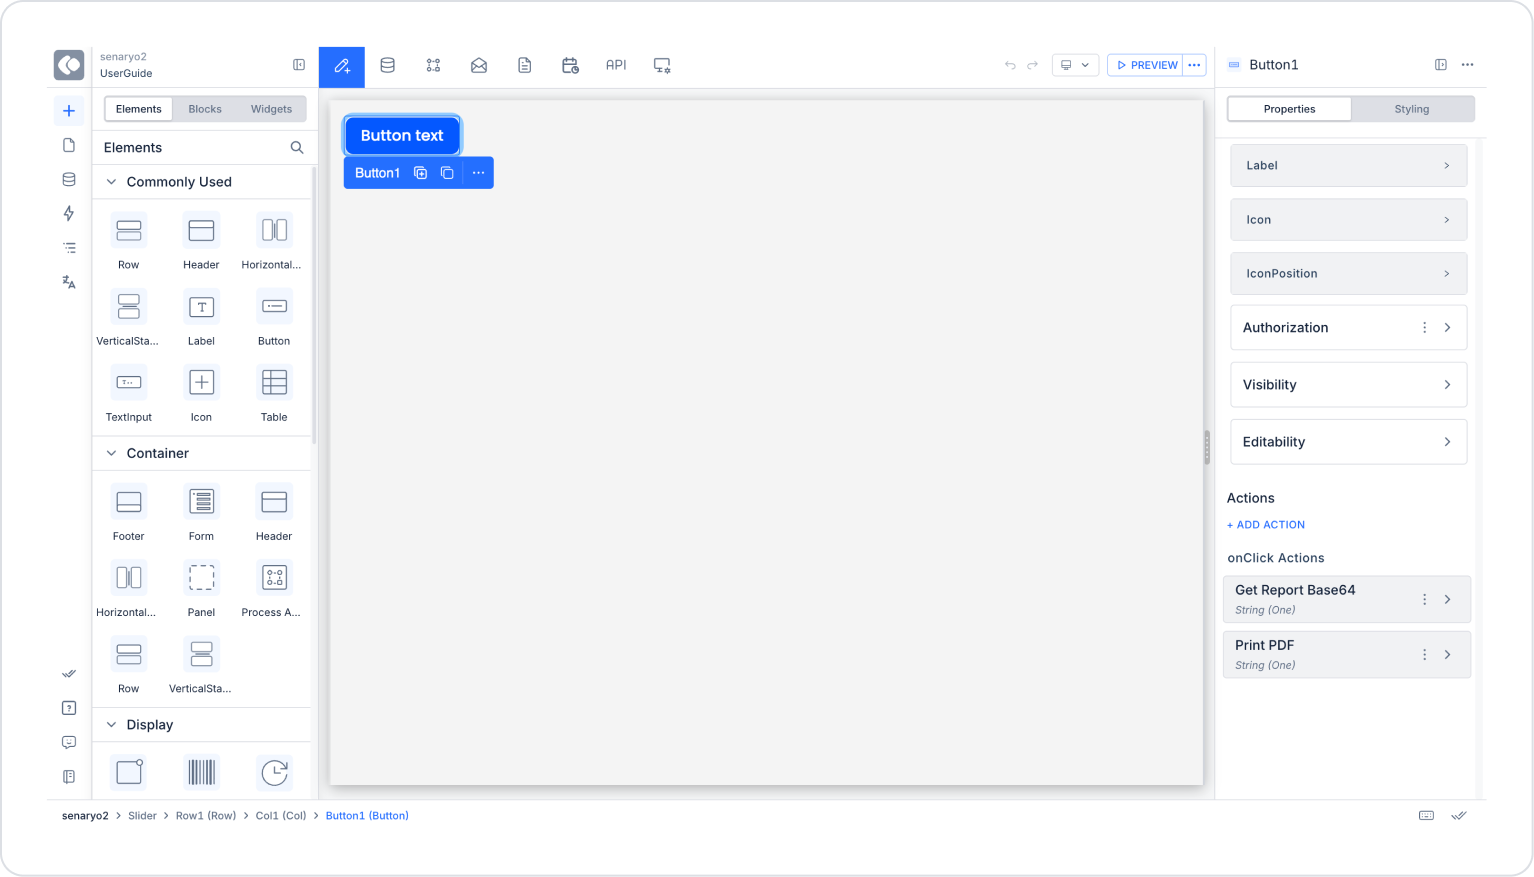
Step 7 – UI Design Operations
Go to the UI Design module to download or print the table.
Add a Button element.
Then add the Properties> Add Action> OnClick > Device > Get Report Base64 action to the Button element.
Next, add the Properties> Add Action> OnClick > Device > Print PDF action in the same way.
Return to the Report Designer module.
Click the Preview button in the upper right corner.
Preview
When the application is tested, an Invoice List Report is displayed, listing invoices line by line within the Report Table. Each line presents the invoice number, invoice date, recipient company name, invoice status, amount, and currency information in an organized and readable format.
When a PDF output is generated, the table structure is preserved, and the invoice list displayed on the screen is reflected in the report output with the same layout. “Paid” and “Overdue” statuses are easily distinguishable at a glance; users can quickly compare invoices.