The Node Tree element allows you to visualize hierarchical structures in a tree format. When connected to dynamic data, structures such as organizational charts, process flows, or category-subcategory relationships can be easily displayed.
The Node Tree element is only supported in web applications.
Organizational Chart Scenario
In a human resources application, Node Tree is used to show employees' positions in the company hierarchy.
The CEO is at the top.
Below are the IT and Human Resources departments.
Employees are listed as nodes under each department.
This structure allows users to easily explore the organization.
Connecting the Data Source
Go to the Datasources module.
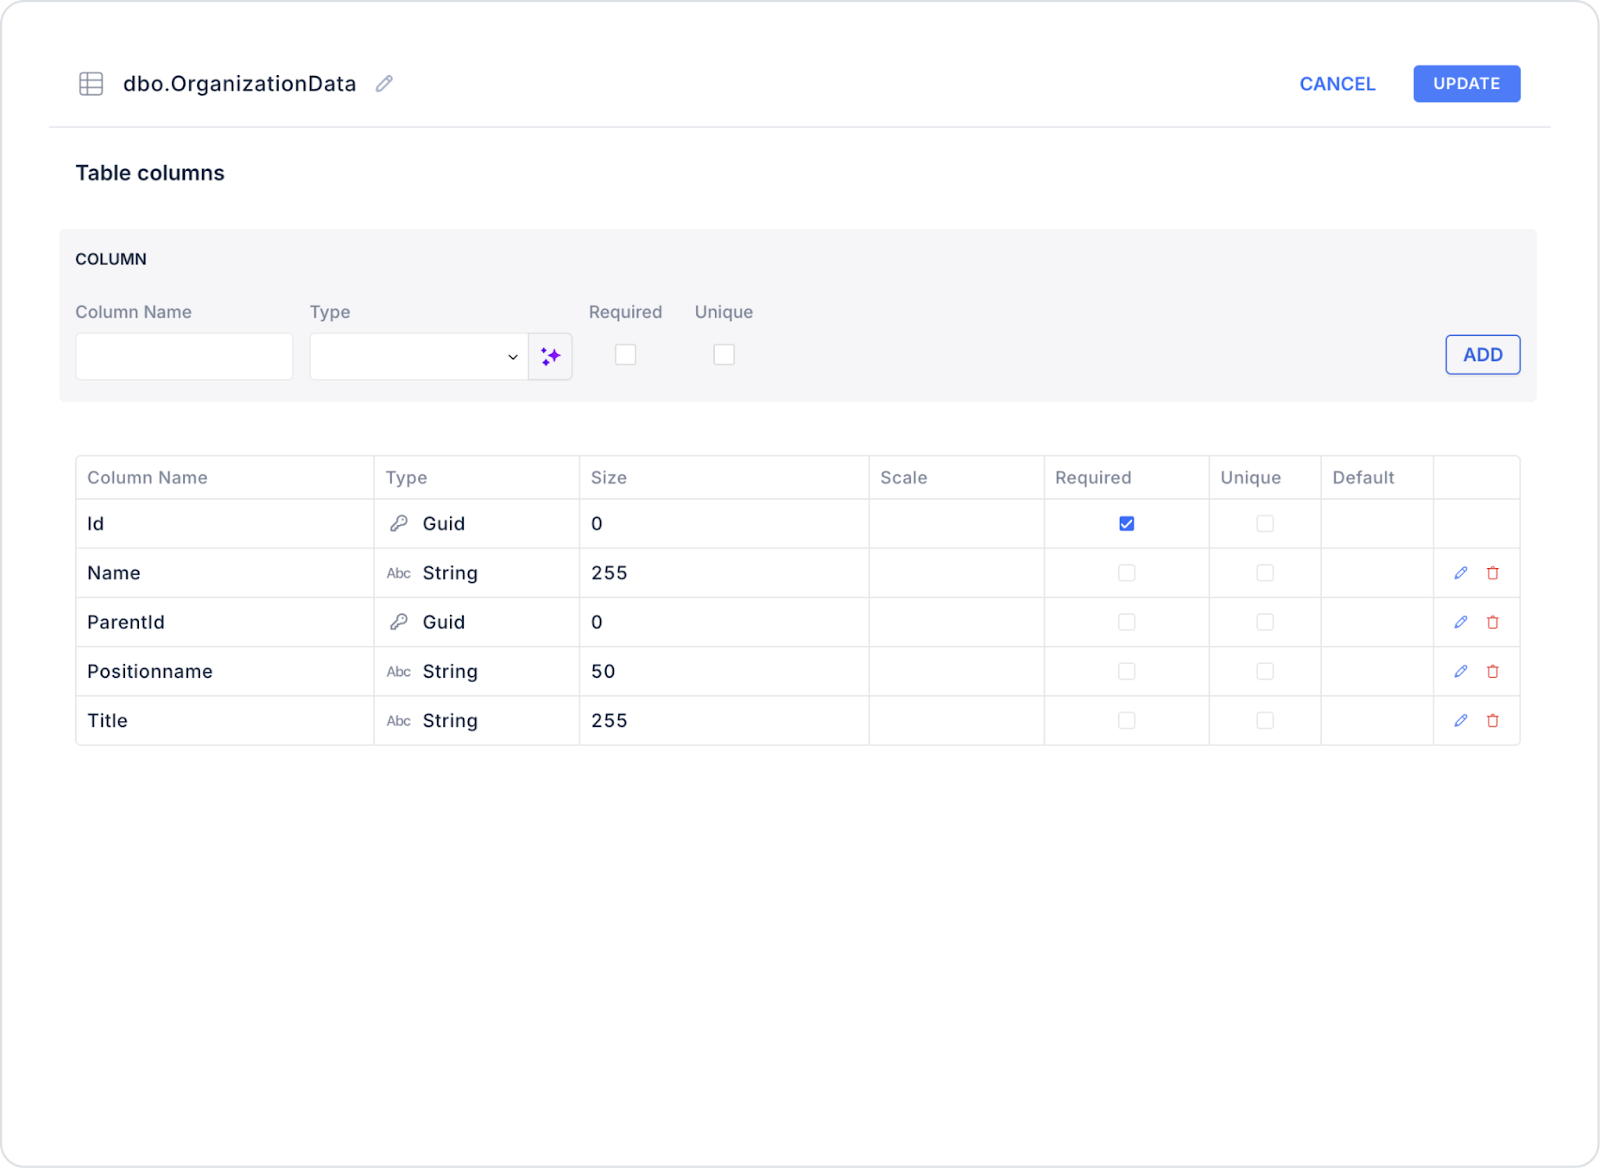
Click the + icon next to the Tables heading and name the table OrganizationData.
Create the following table.
Then click SQL Actions and name the action OrganizationData. You can also create it with C#.
Enter the following SQL command.
SELECT NEWID() AS Id, NULLAS ParentId, ‘CEO’ AS Title, ‘Mary Watson’ AS Name, ‘CEO’ AS PositionNameUNION ALLSELECT NEWID(), (SELECT TOP 1 Id FROM OrganizationData WHERE Title=‘CEO’), ‘IT’ AS Title, ‘’ AS Name, ‘Department’ AS PositionNameUNION ALLSELECT NEWID(), (SELECT TOP 1 Id FROM OrganizationData WHERE Title=‘CEO’), ‘Human Resources’ AS Title, ‘’ AS Name, ‘Department’ AS PositionNameUNION ALLSELECT NEWID(), (SELECT TOP 1 Id FROM OrganizationData WHERE Title=‘IT’), ‘Software Team’ AS Title, ‘Ali Vural’ AS Name, ‘Engineer’ AS PositionNameUNION ALLSELECT NEWID(), (SELECT TOP 1 Id FROM OrganizationData WHERE Title=‘Human Resources’), ‘HR Specialist’ AS Title, ‘Ayşe Demir’ AS Name, ‘Specialist’ AS PositionName;
UI Design Module operations
Click the Add Action button on the right side of the application screen.
Then select Custom > OrganizationData.
Using Properties in the Scenario Context
Options
Description: The data source to which the Node Tree is connected.
Usage: OrganizationData.
Action
Description: The data source action to connect to the Node Tree.
Usage: OrganizationData is selected.
Field Node ID
Description: The field that uniquely identifies each node.
Usage: Id in the table.
Field Node Parent ID
Description: Shows the parent node to which the node is connected.
Usage: ParentId in the table.
Orientation
Description: Determines the direction of the structure.
Usage: vertical → vertical organization chart.
initialExpandLevel
Description: Number of levels to expand initially.
Usage: 2 → CEO and departments below are expanded.
levelDistance
Description: Distance between node levels.
Usage: A value such as 120 px can be specified.
siblingsMargin
Description: The space between nodes at the same level.
Usage: The distance between department cards.
linksColor
Description: The color of the connection lines.
Usage: Black or gray in the organizational diagram.
When the Scenario Step is Complete
The CEO appears at the top.
Departments (IT, Human Resources) are listed below.
Employees associated with each department are displayed as nodes.
Users can zoom in/out between nodes.
Clicking on a node redirects to the details screen.
Limitations
Currently, the number of nodes cannot be increased manually; they are only added via dynamic data.
Performance issues may occur with very large data sets (hundreds of nodes).
Readability may decrease when using multi-level diagrams on mobile screens.
Tips and Best Practices
Rows with an empty ParentId field in the data source are taken as the root node.
It is ideal to start with 2–3 levels open in organizational diagrams.
Prefer link colors (linksColor) with high color contrast.
Balance the siblingsMargin and levelDistance values to prevent visual clutter.
Use profile images to make the diagram more understandable.
Be sure to enable the zoom feature for very large organizations.