Elastic APM (Application Performance Monitoring) is a monitoring mechanism used to monitor your application's performance, detect errors, and analyze transaction times.
By configuring Elastic APM settings through the Kuika Configuration Manager module, you can centrally track your application's runtime behavior.
With Elastic APM settings:
Application transaction performance can be monitored,
Errors and exceptions can be analyzed,
Service-based performance measurements can be made,
Environment-based (production, development, etc.) separation is provided.
How to Configure Elastic APM Settings?
1. Add Configuration to the Application
Log in to the Kuika platform.
Open the project you will be working on from the Apps screen.
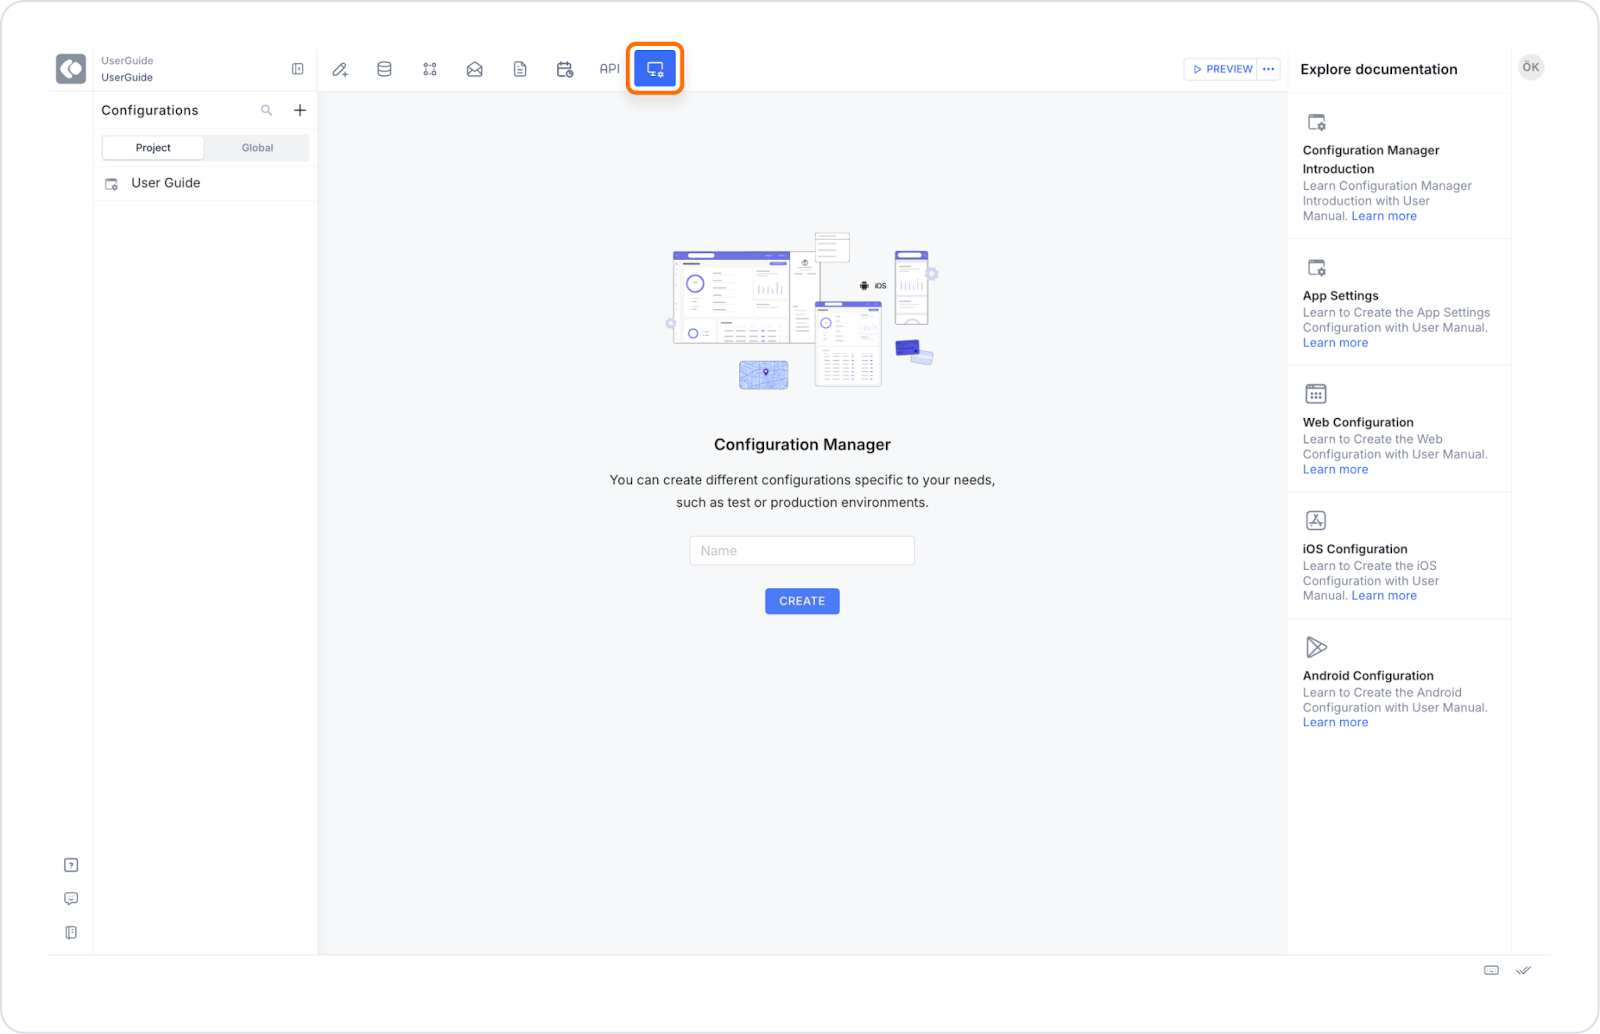
Click on the Configuration Manager module.
On the screen that opens, give the configuration a name and click the CREATE button.
2. Configure Elastic APM Settings
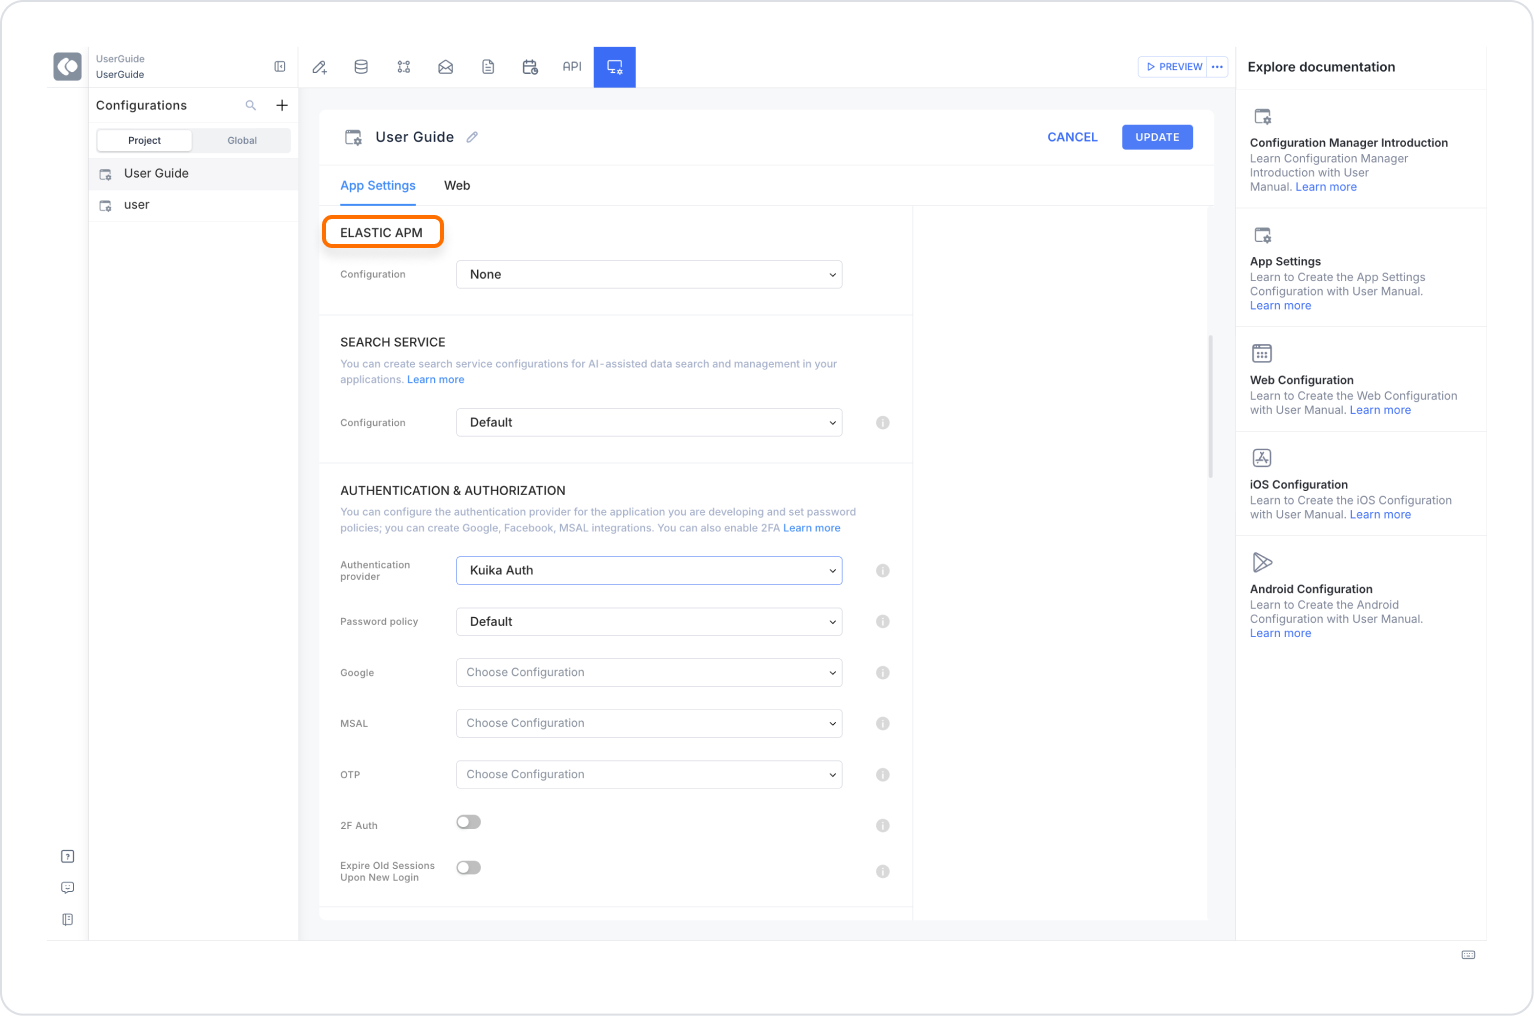
After creating a new configuration, open the App Settings screen.
Go to the App Settings area.
Find the Elastic APM section.
Click on the Configuration drop-down menu.
Select the ADD NEW option from the menu that opens.
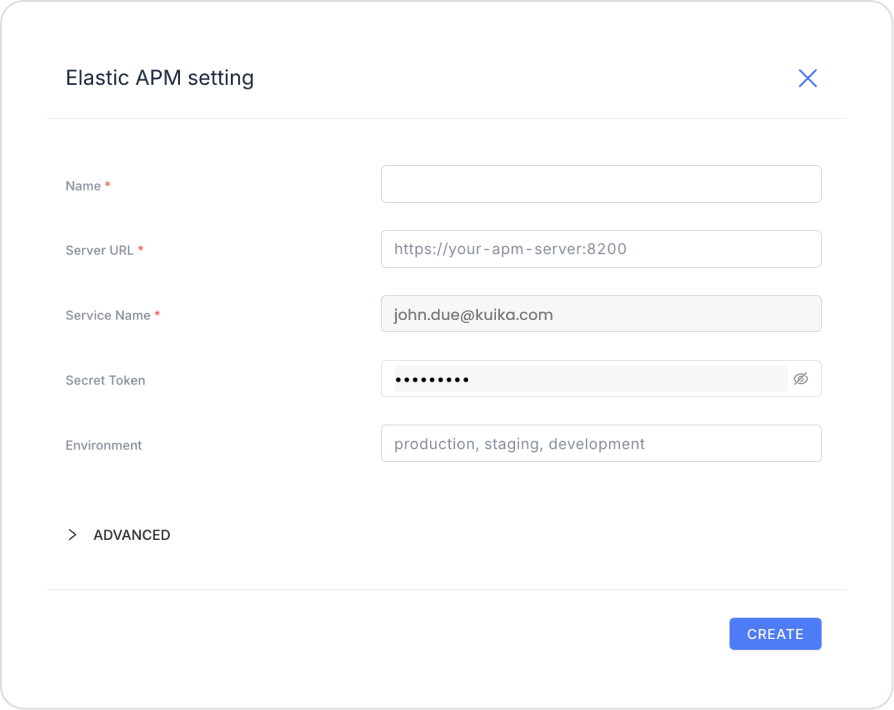
Configure the following fields in the Elastic APM setting pop-up window that opens:
Basic Fields
Name: Name to be given to the Elastic APM configuration.
Server URL: Elastic APM Server address.
Example:https://your-apm-server:8200
Service Name: Name of the service to be monitored by APM. Used to distinguish services in the Elastic APM interface.
Secret Token: Security token provided by the Elastic APM Server.
Environment: Information about the environment in which the application runs.
Example values: production, staging, development
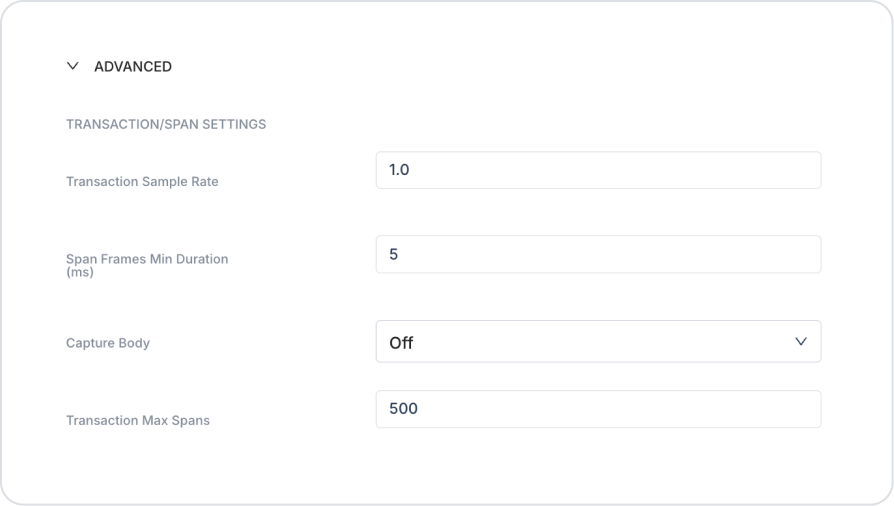
3. Configure Advanced Settings (Optional)
You can control transaction and performance details by expanding the ADVANCED field.
Transaction / Span Settings
Determines how transactions and spans within the application will be monitored.
Transaction Sample Rate: Specifies the rate at which transactions will be monitored. A value of 1.0 ensures that all transactions are monitored.
Span Frames Min Duration (ms): Specifies the minimum duration (in milliseconds) for stack trace capture.
Capture Body: Specifies whether request/response body information will be monitored. The default setting is Off.
Transaction Max Spans: Specifies the maximum number of spans that can be created within a single transaction.
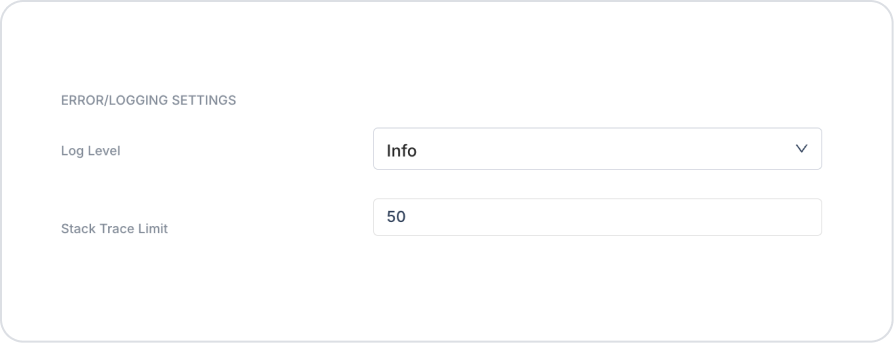
Error / Logging Settings
Controls error logging and logging details.
Log Level: Specifies the log level to be sent by Elastic APM.
Example values:
Error
Warning
Info
Debug
Stack Trace Limit: Specifies the maximum number of stack trace lines to be captured when an error occurs.
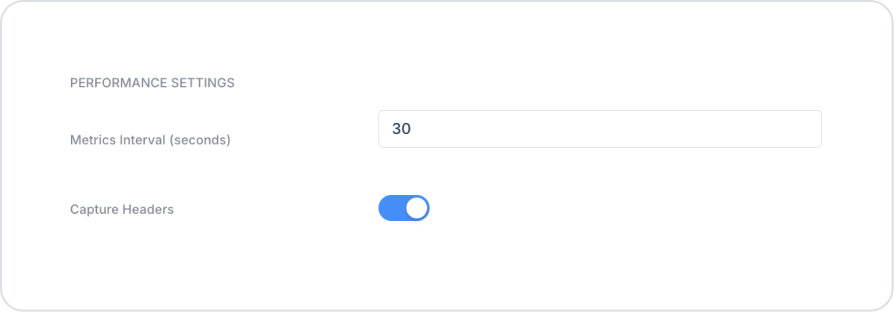
Performance Settings
Defines the frequency and scope of application performance metric collection.
Metrics Interval (seconds): Defines the interval in seconds for sending system and application metrics to Elastic APM.
Capture Headers: Defines whether HTTP request and response header information will be tracked. When this setting is enabled, header-based analysis can be performed via Elastic APM.
4. Test the Settings
Click on the three dots next to the Preview button at the top of the application.
Click on the RUN button in the menu that opens.
After the application runs, check the Elastic APM dashboard to ensure that:
The service is listed
Transaction and error logs are created.
After configuring the Elastic APM settings, ensure that performance data is collected correctly by creating transactions on different screens and actions of the application. Incorrectly or incompletely configured Server URL, Secret Token, or Service Name fields may prevent APM data from being transmitted.